🧬 Single-Cell Analysis Report
6964
Cell-Cell Interactions
158
TF-Target Pairs
1763
Significant DEGs
162
Enriched GO Terms
📡 Cell-Cell Communication Analysis
Analysis of intercellular communication via ligand-receptor interactions.
●
Identified 6964 significant ligand-receptor interactions
●
Top signaling pathway: IGF
●
Most active sender cell type: Macrophages
●
Most active receiver cell type: Adipocytes
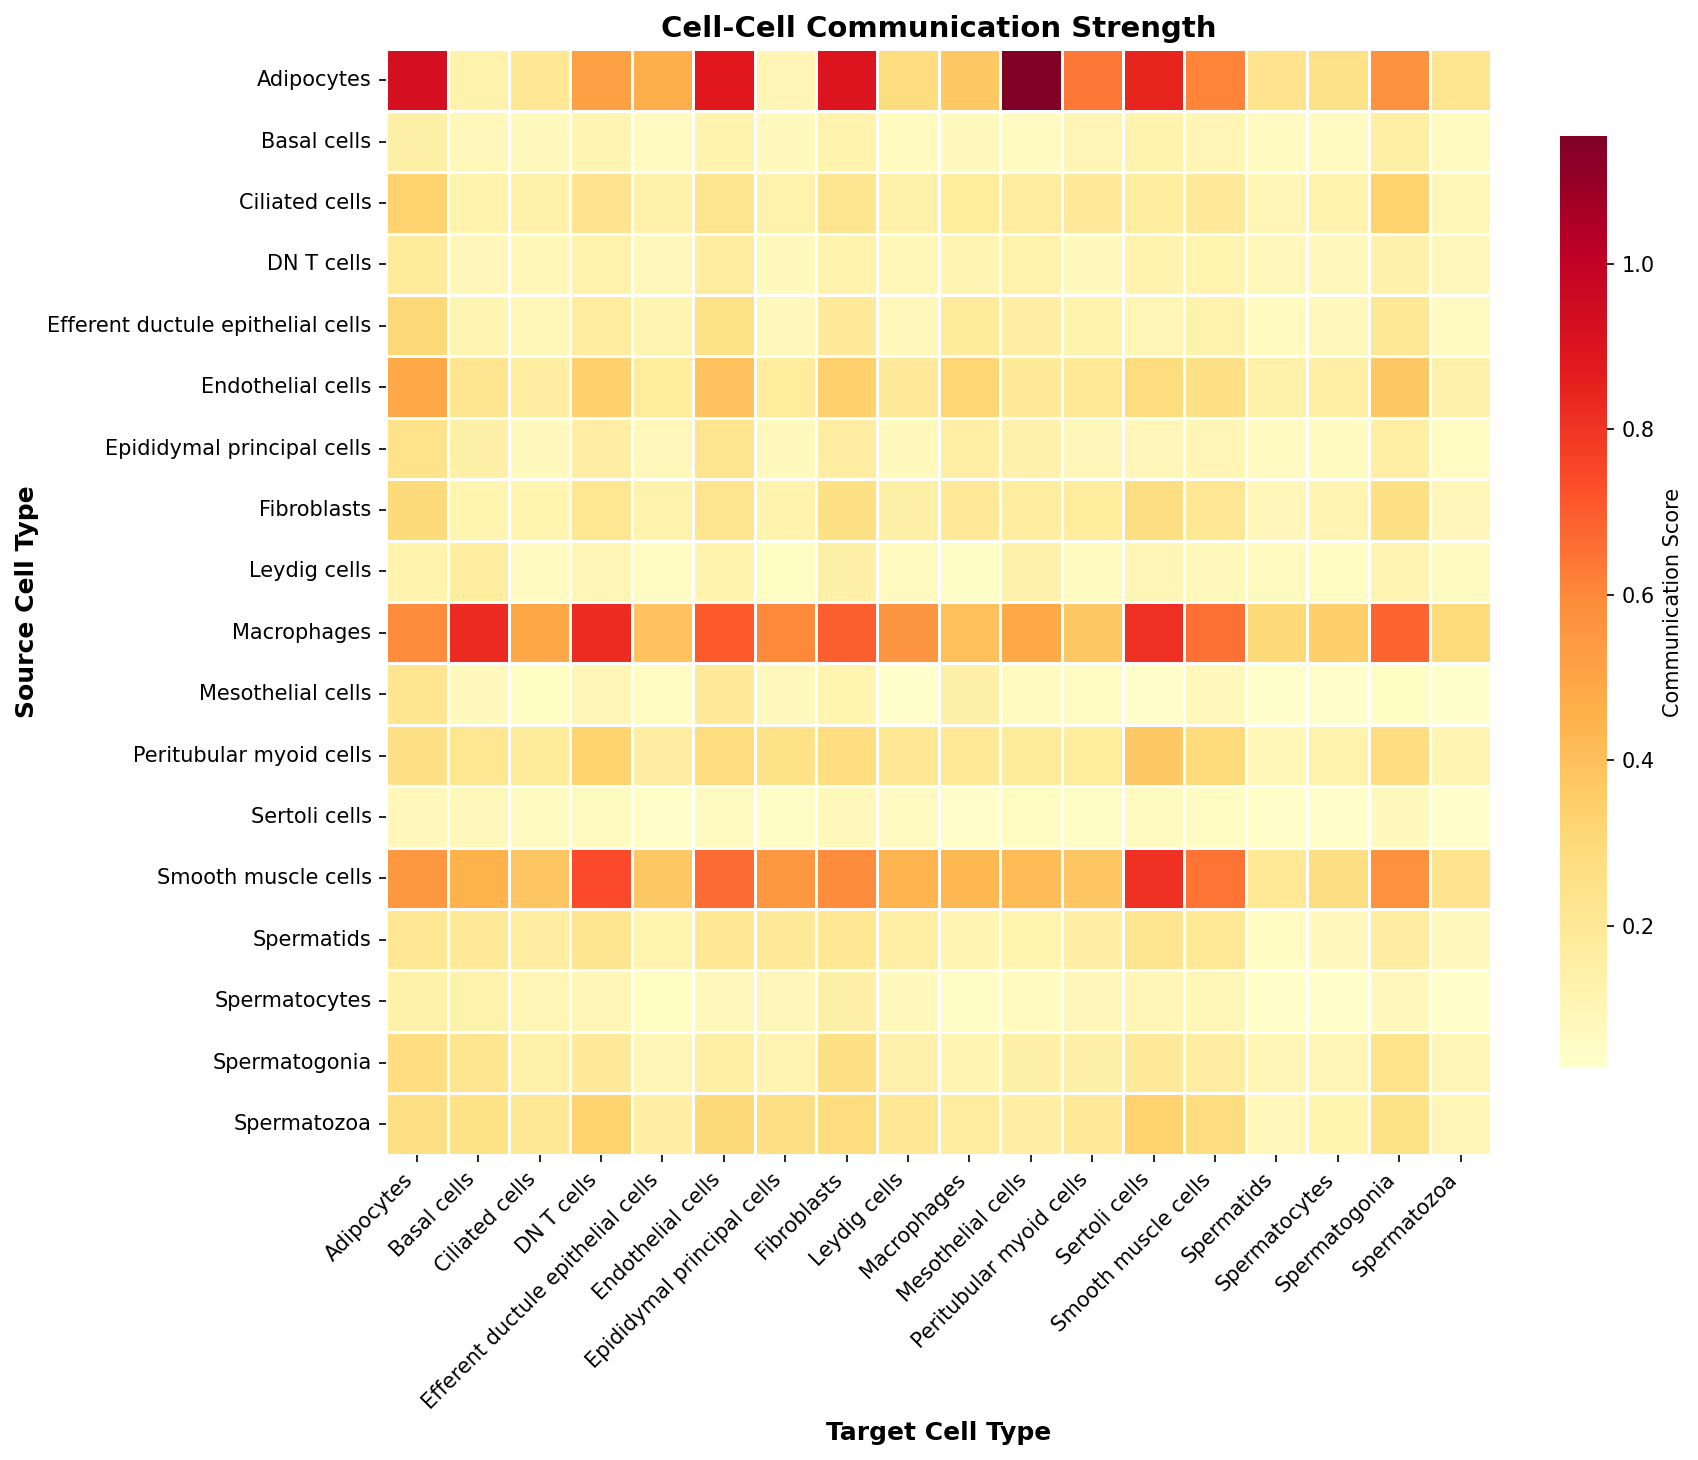
Cell-Cell Communication Heatmap
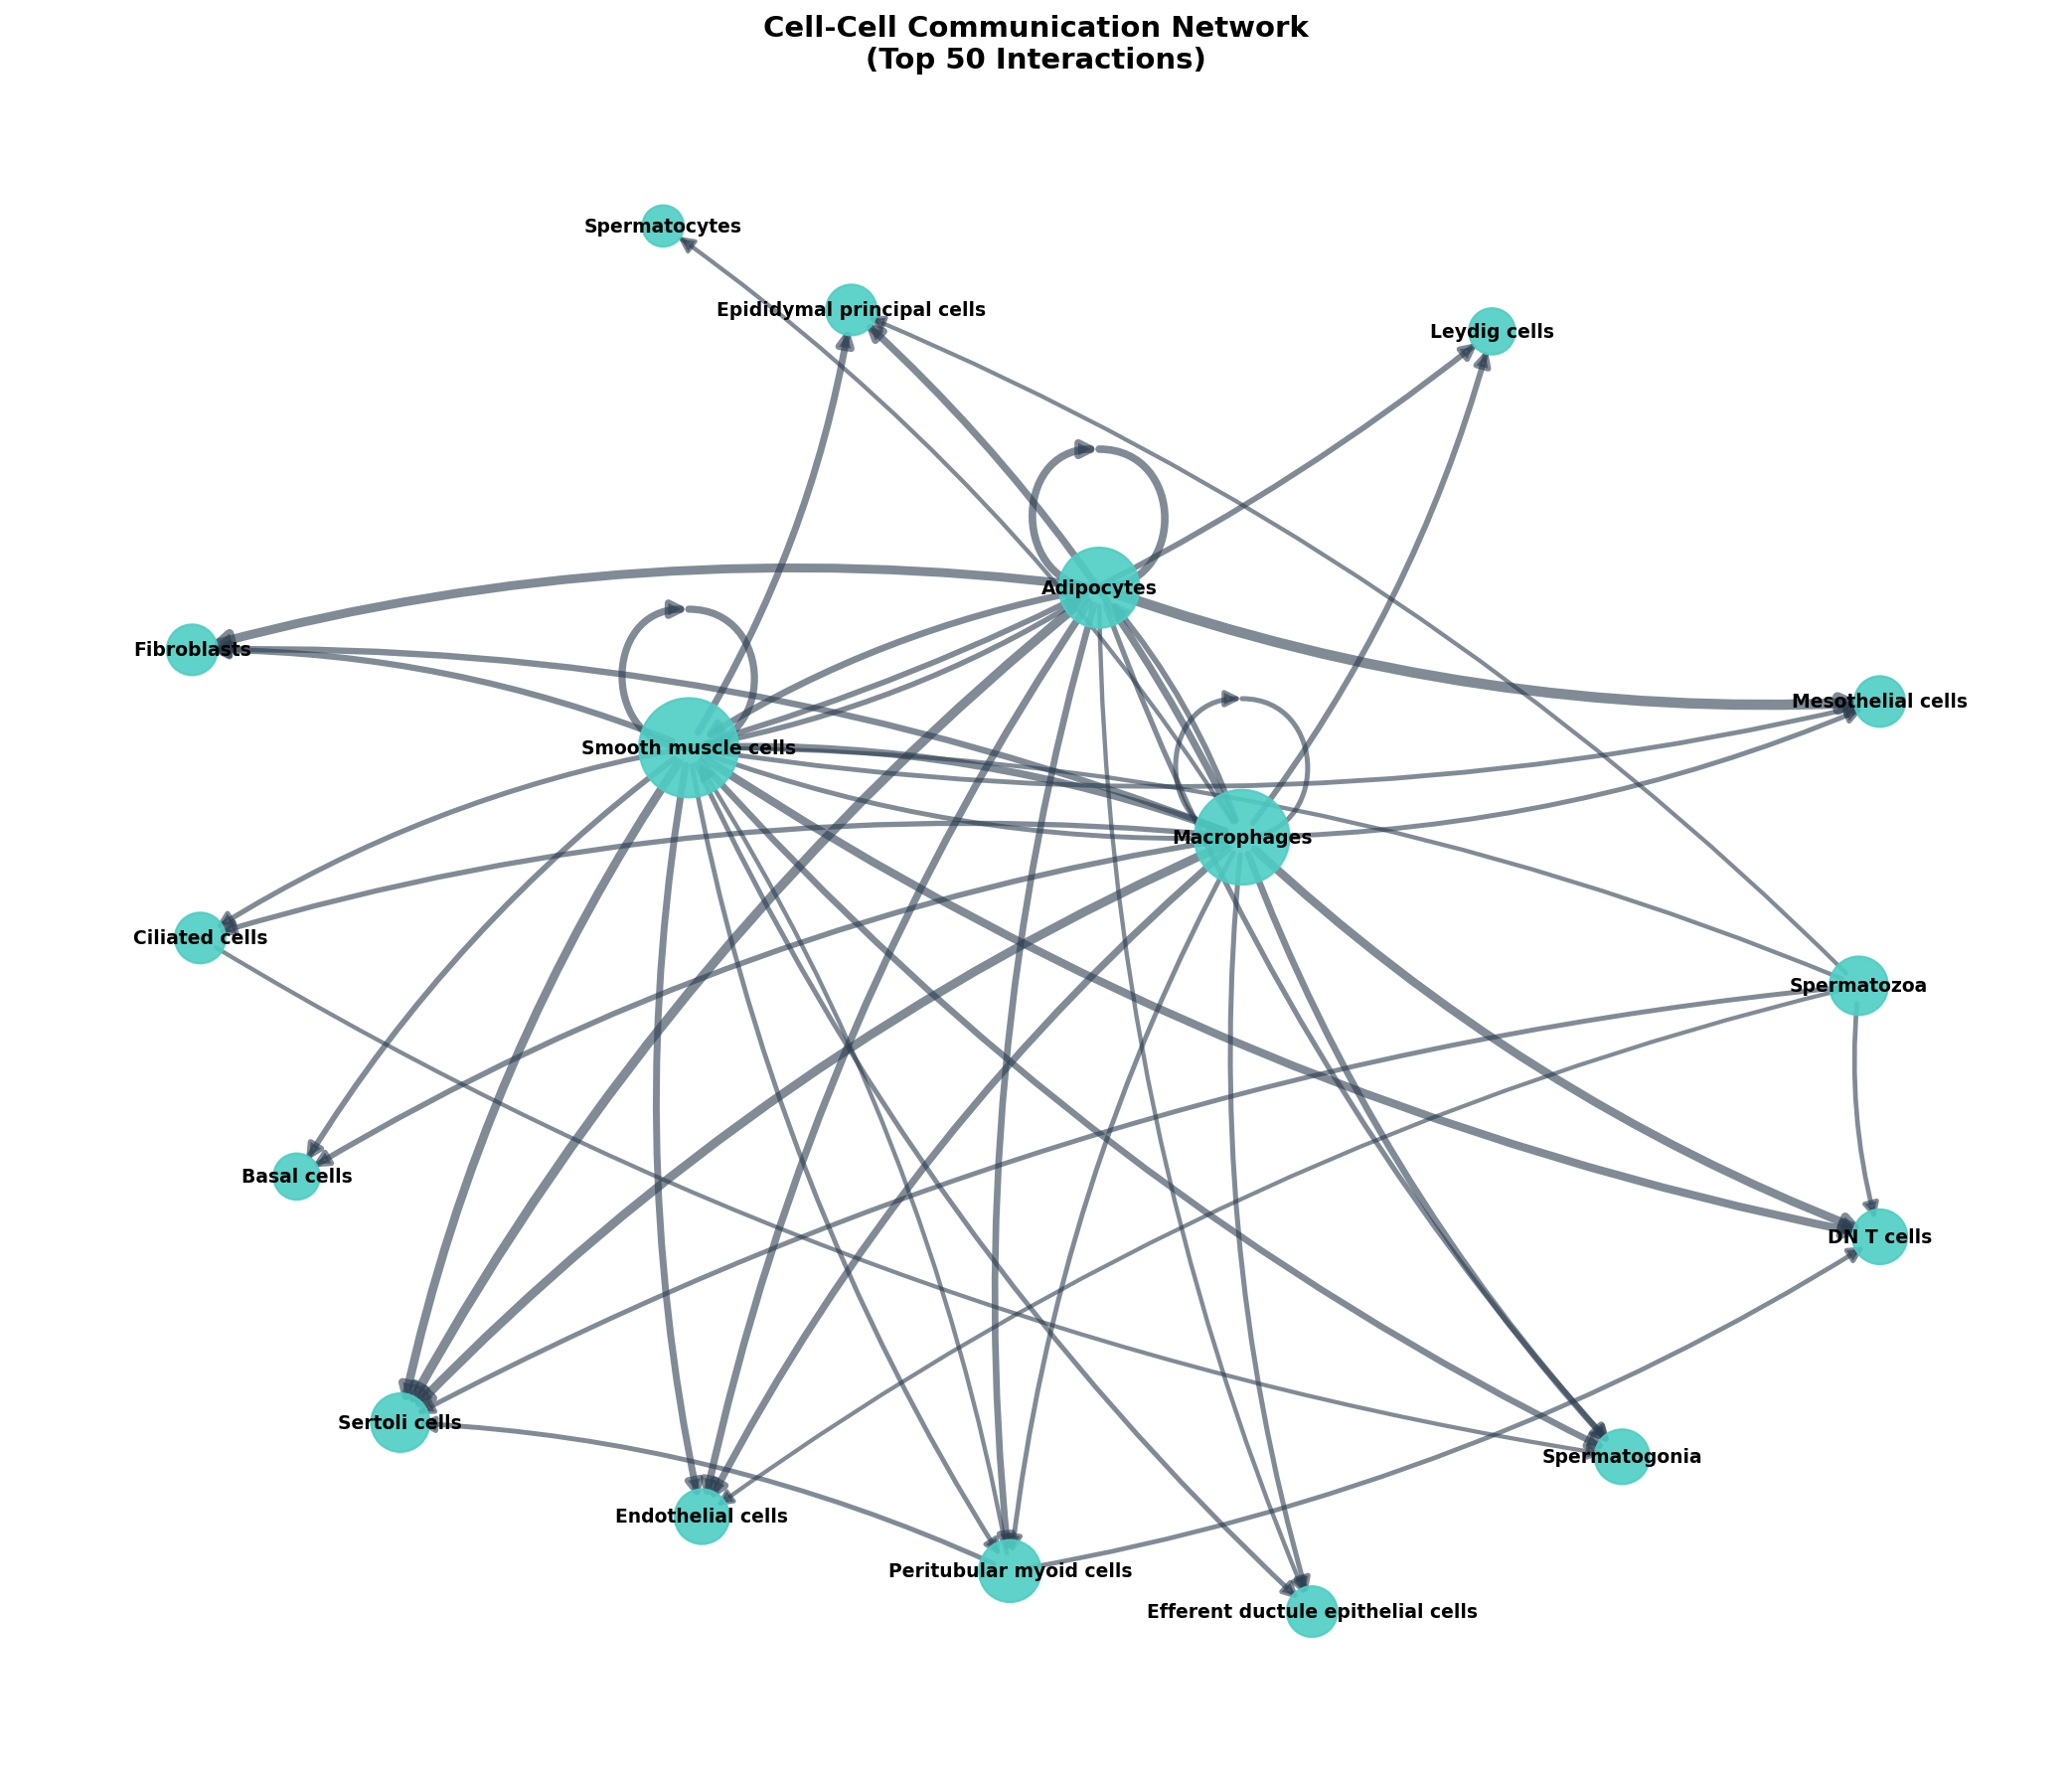
Communication Network Graph
🧬 Gene Regulatory Network Analysis
Transcription factor regulatory relationships inferred from expression data.
●
Analyzed 90 transcription factors
●
Identified 158 TF-target gene relationships
Top Regulatory TFs
| Transcription Factor | Target Genes |
|---|---|
| RUNX1 | 31 |
| RUNX2 | 31 |
| GATA4 | 31 |
| GATA3 | 23 |
| STAT3 | 16 |
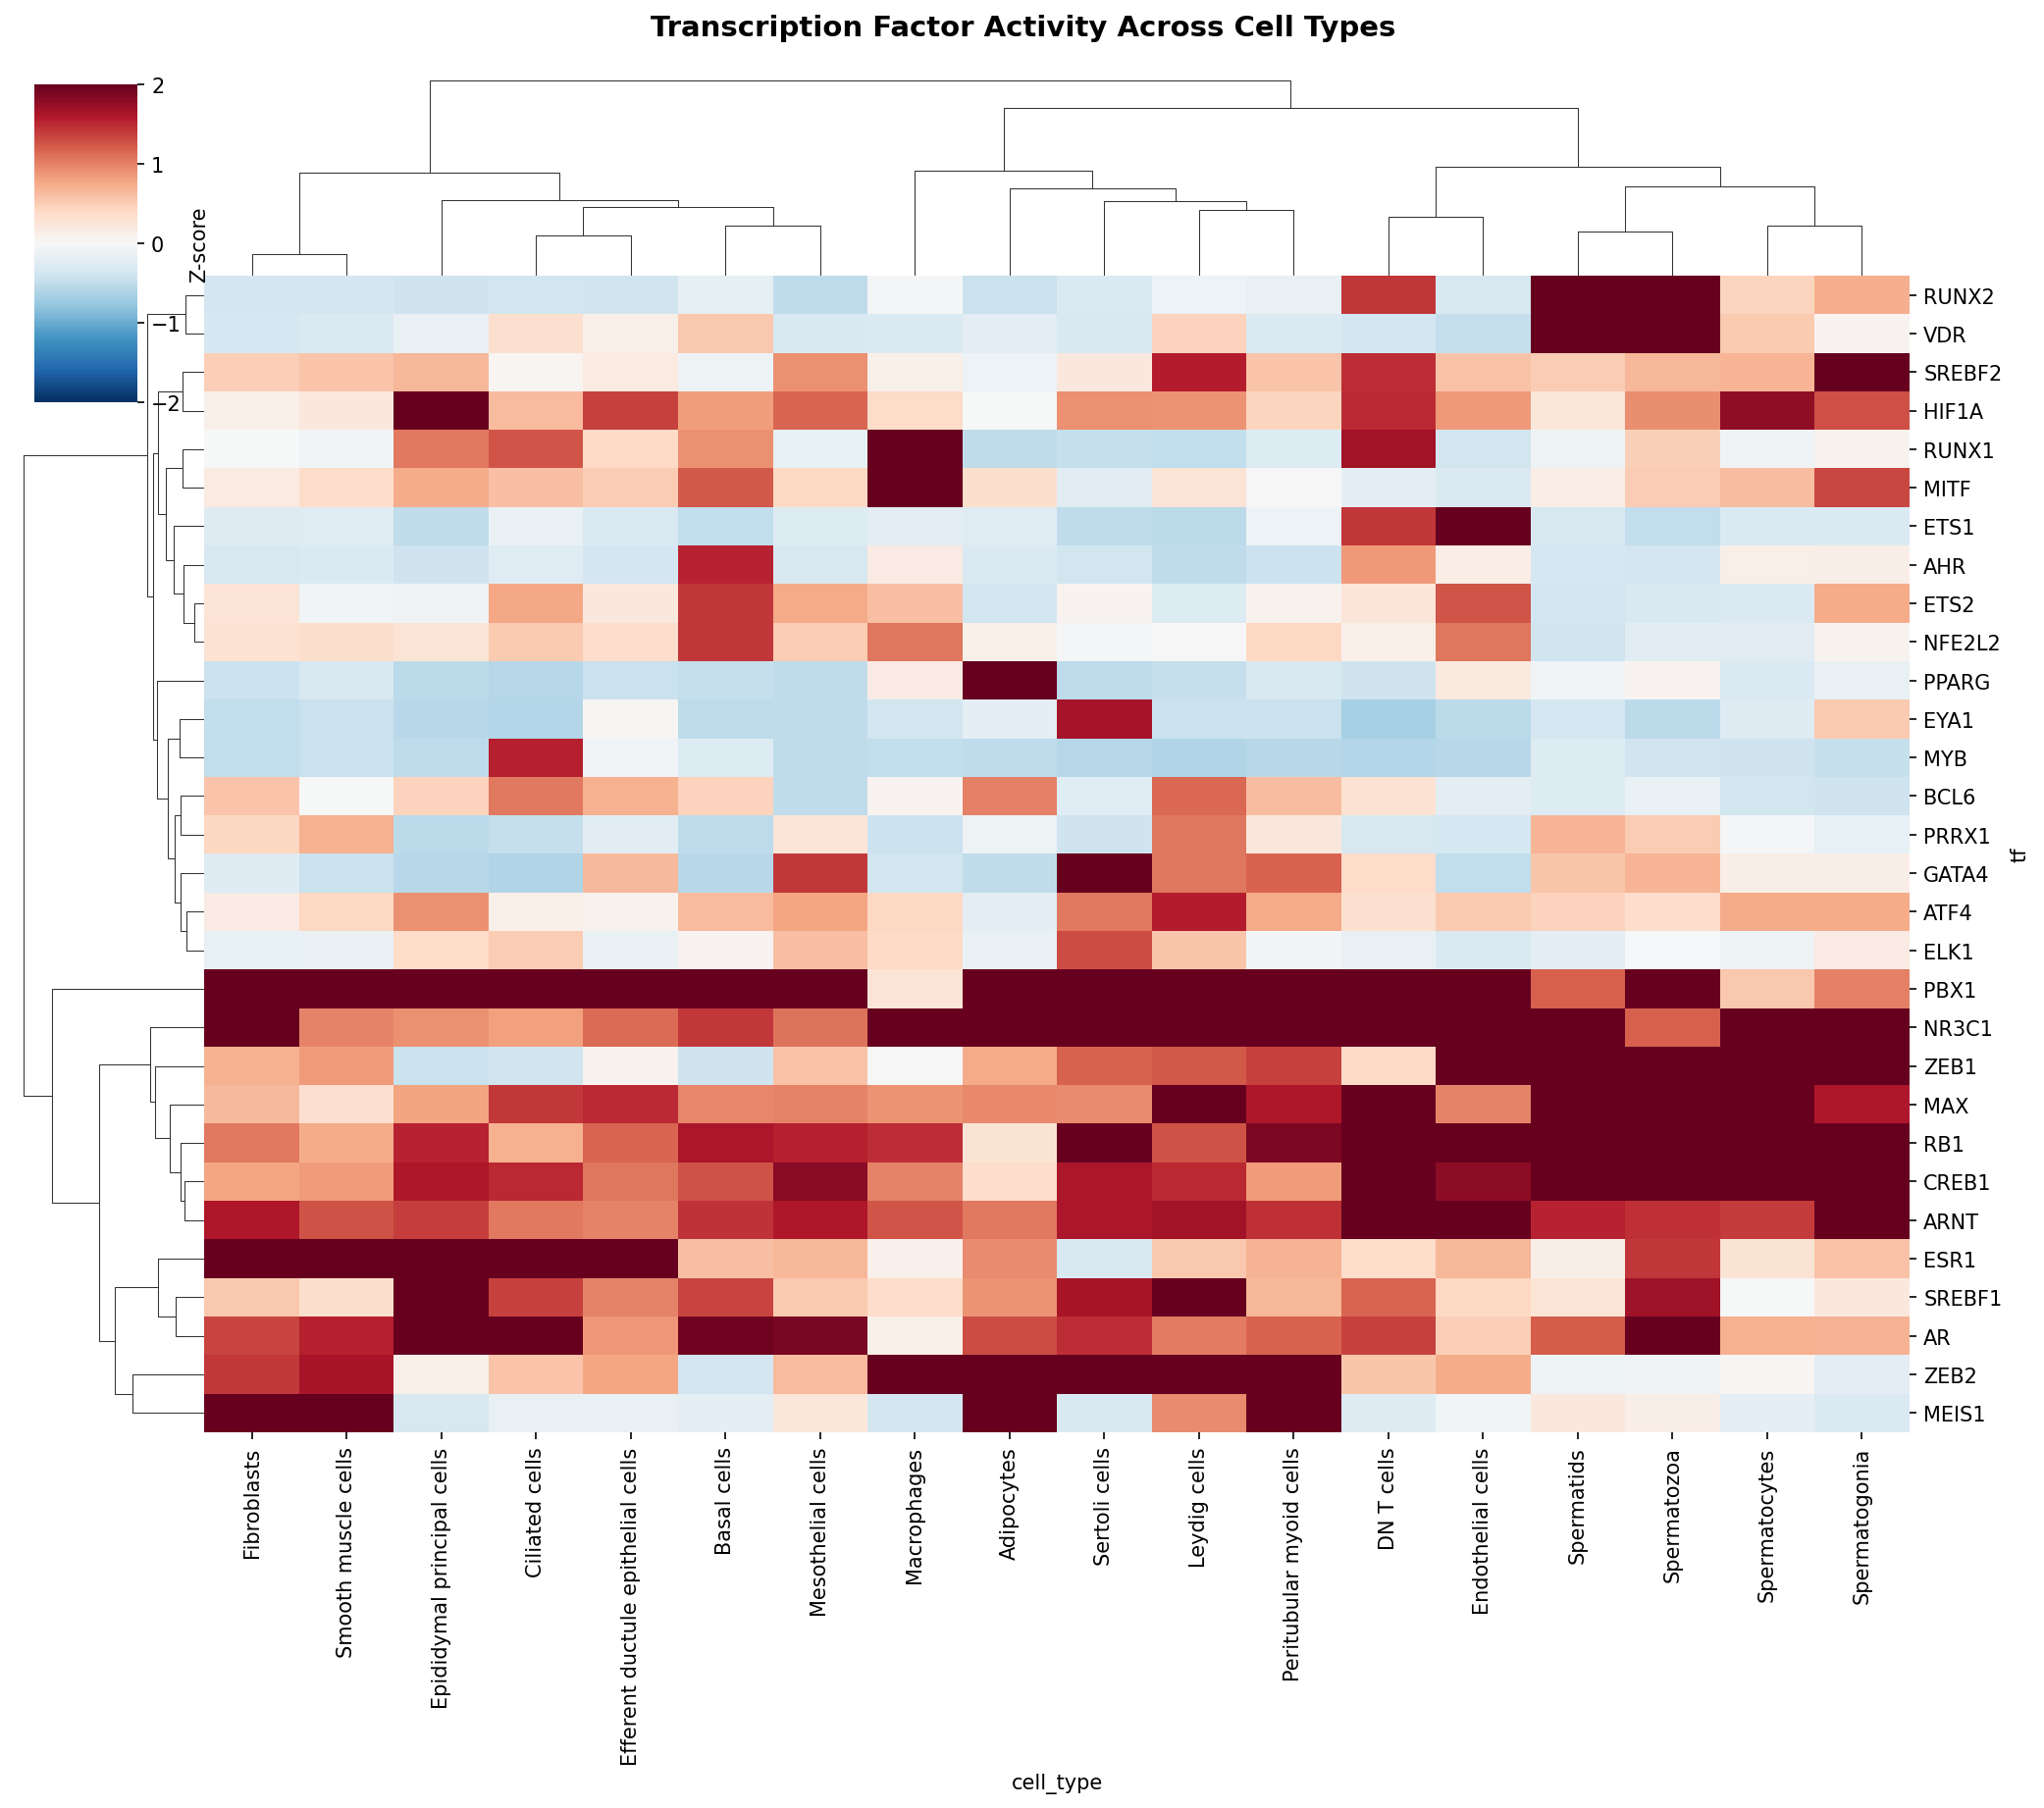
TF Activity Across Cell Types
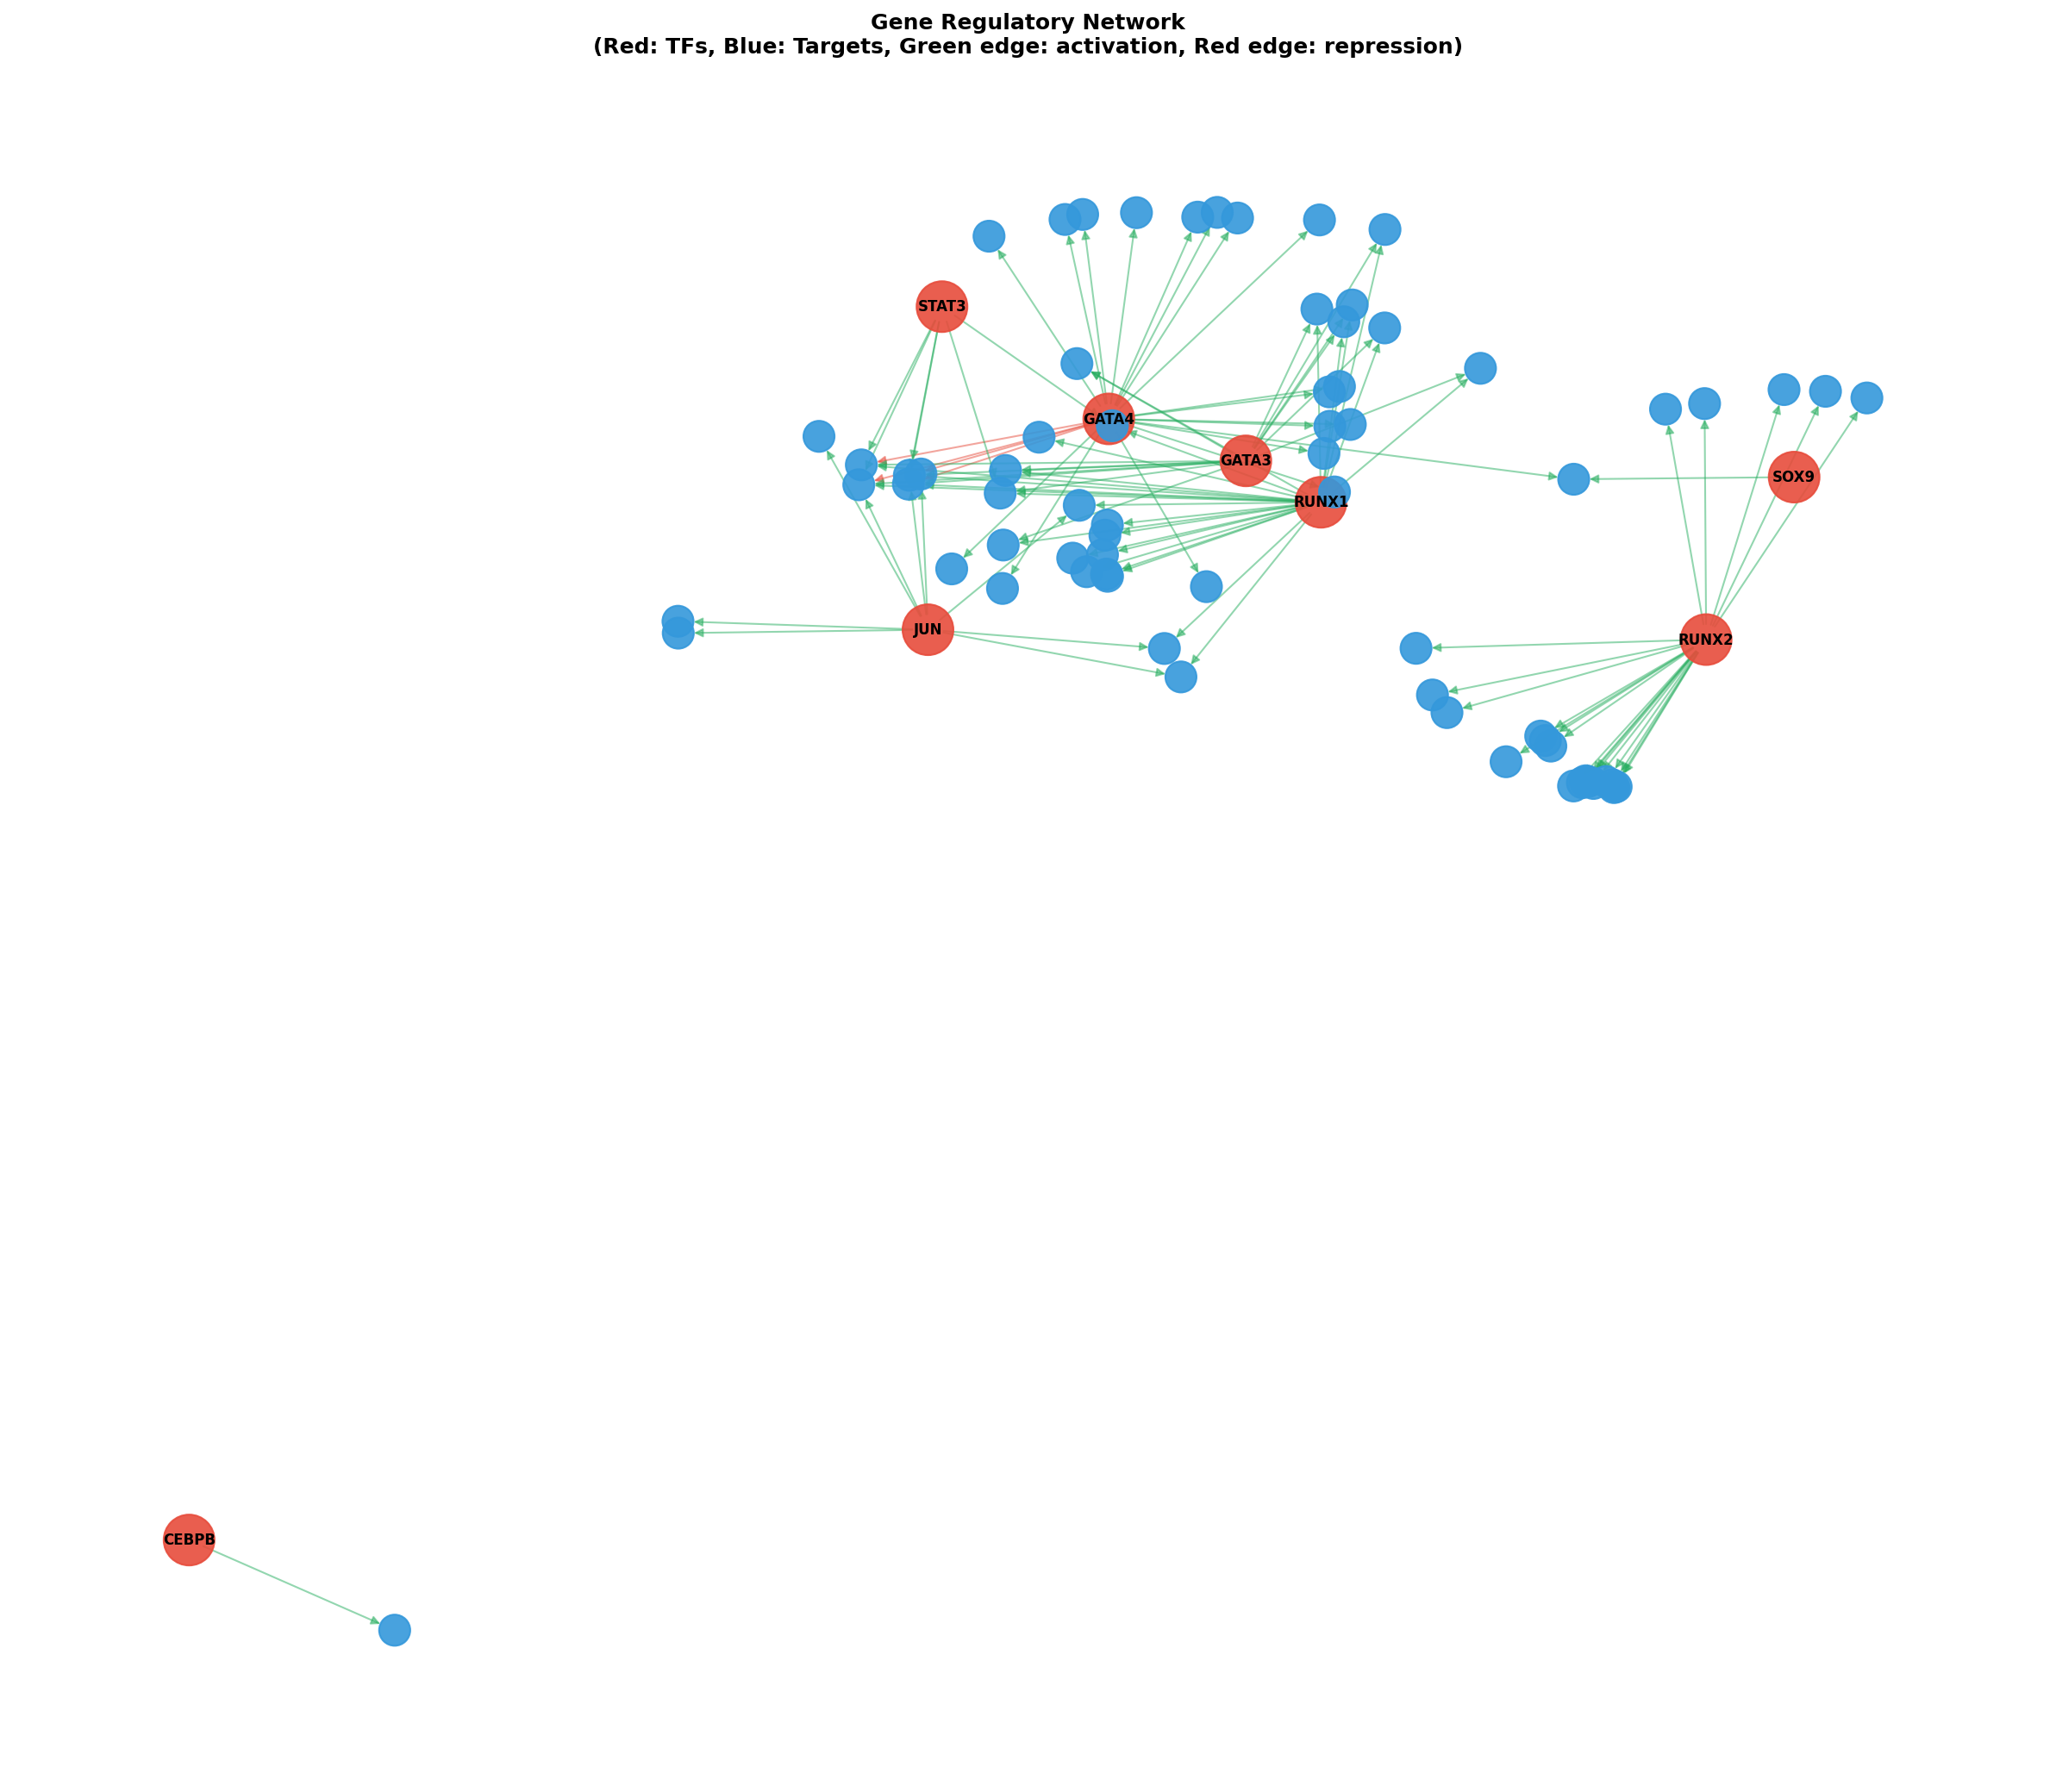
Gene Regulatory Network
🔗 Gene Co-expression Network Analysis
WGCNA-style weighted gene co-expression network analysis.
●
Identified 30 co-expression modules
●
Analyzed 2000 highly variable genes
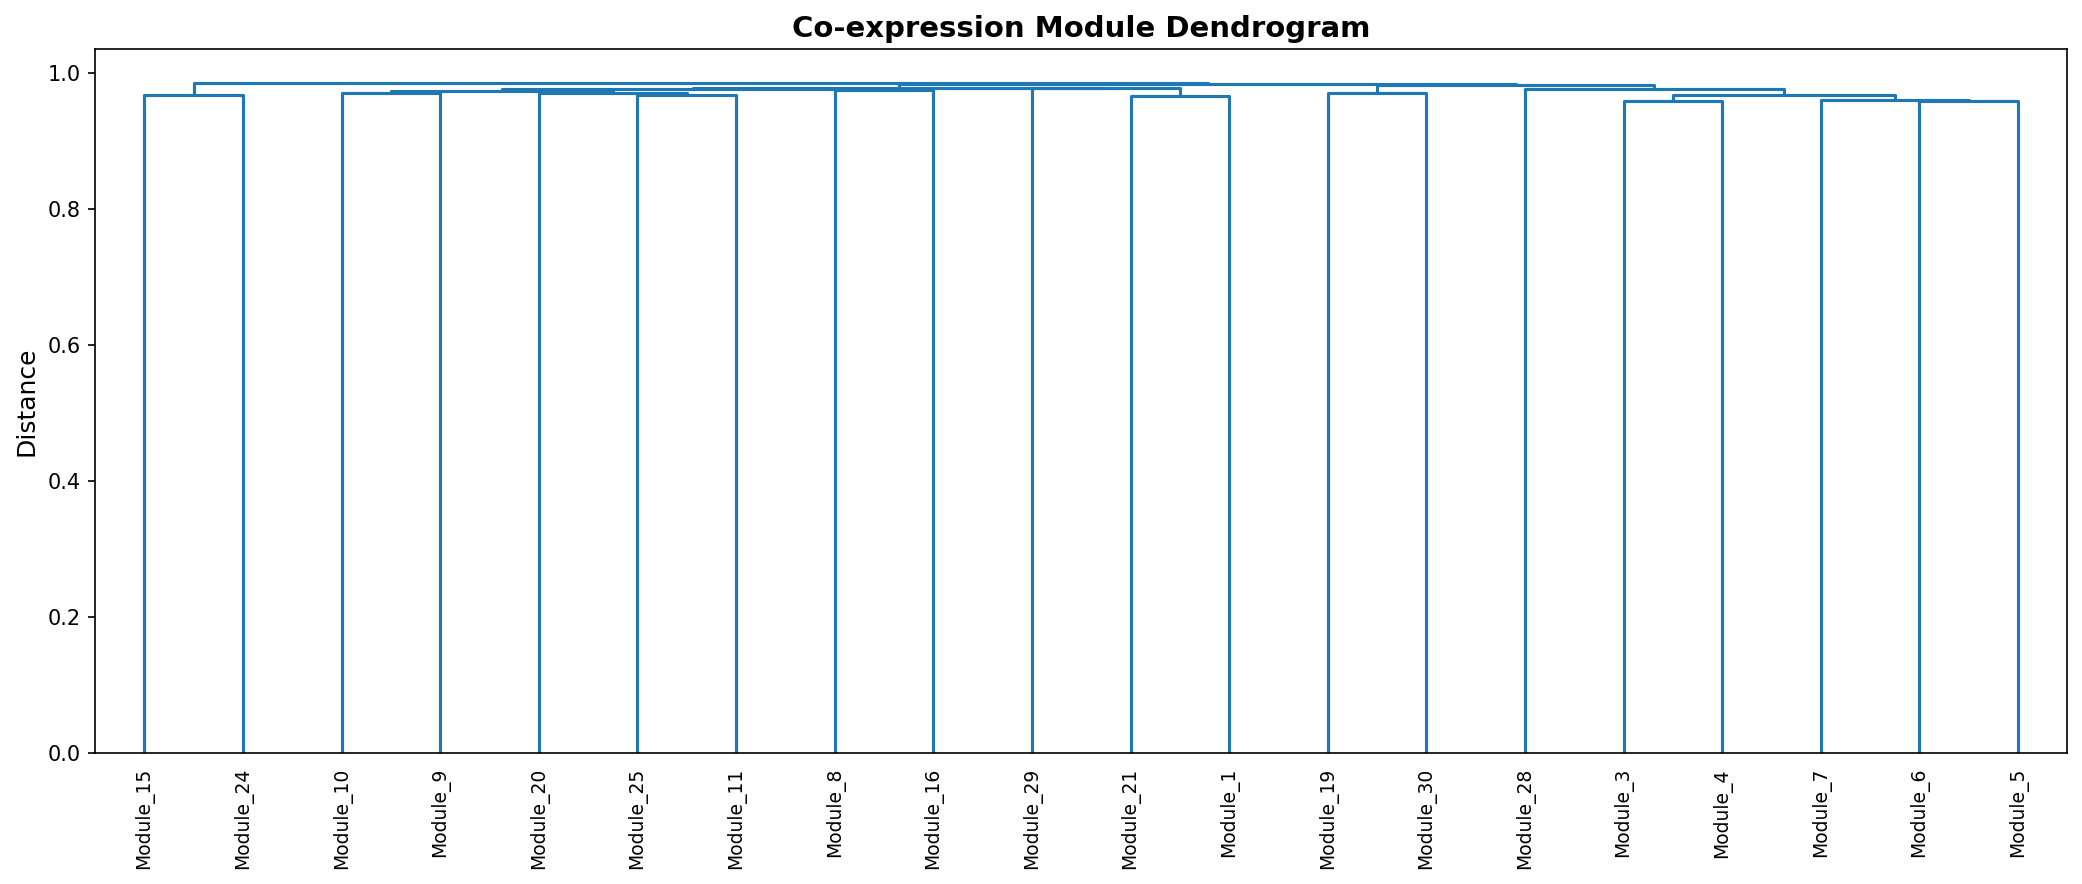
Module Dendrogram
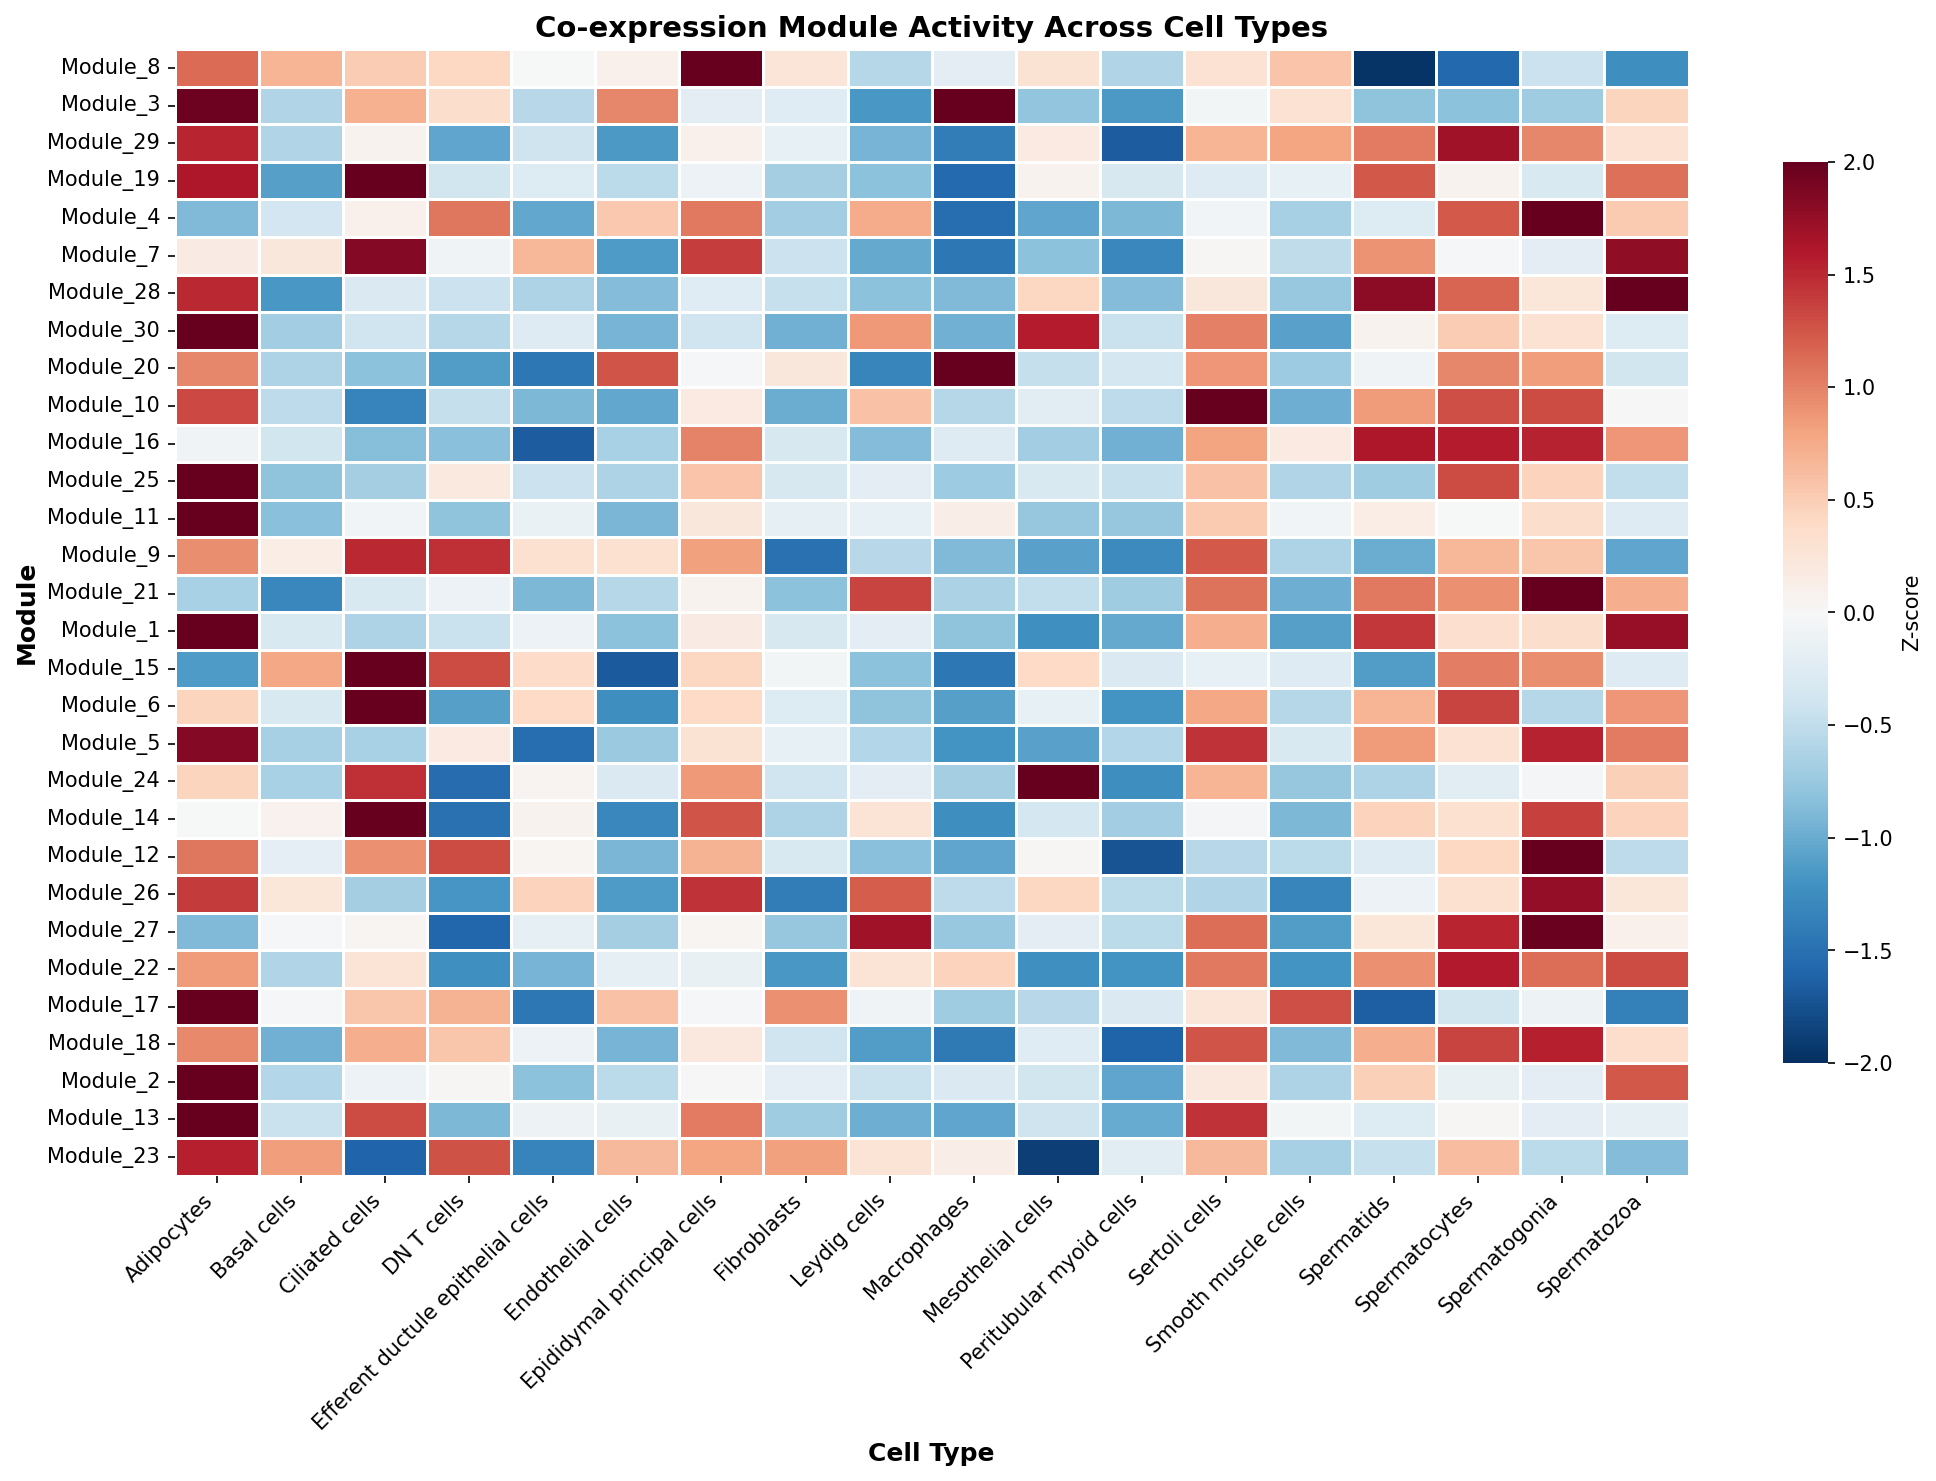
Module-Cell Type Association
📊 Differential Expression Analysis
Cell type-specific marker genes and differential expression.
●
Tested 1800 gene-celltype combinations
●
Found 1763 significant DEGs
●
Across 18 cell types
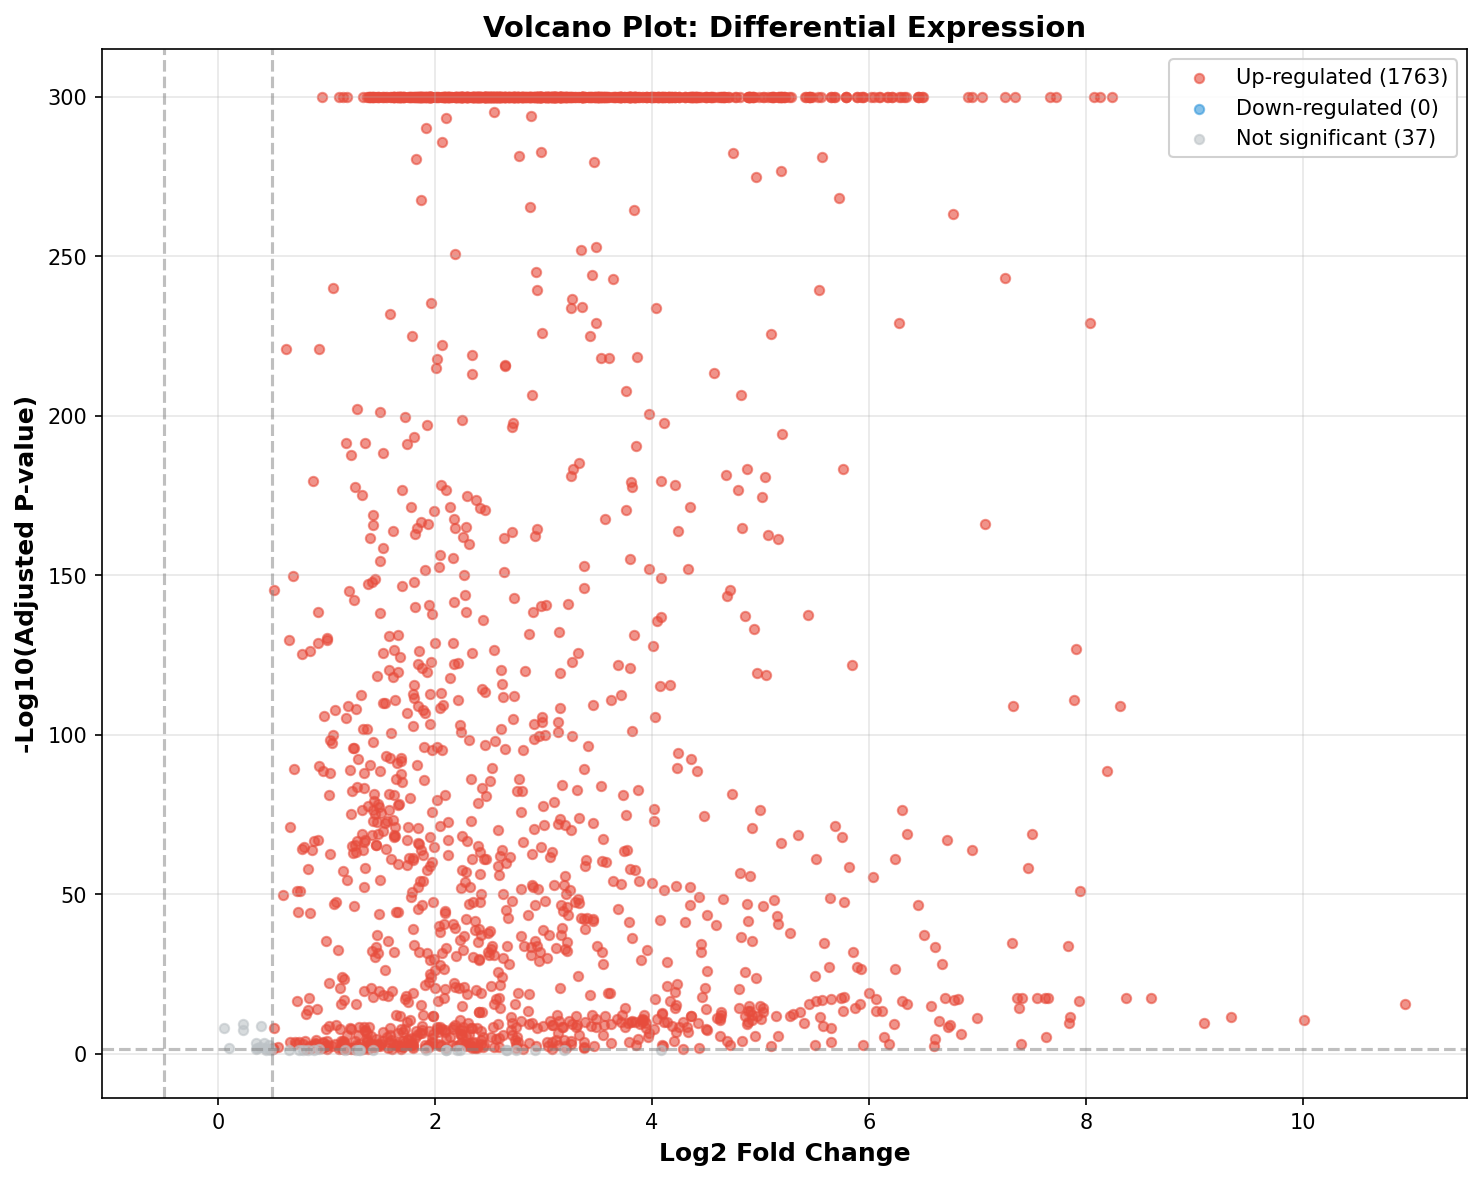
Volcano Plot
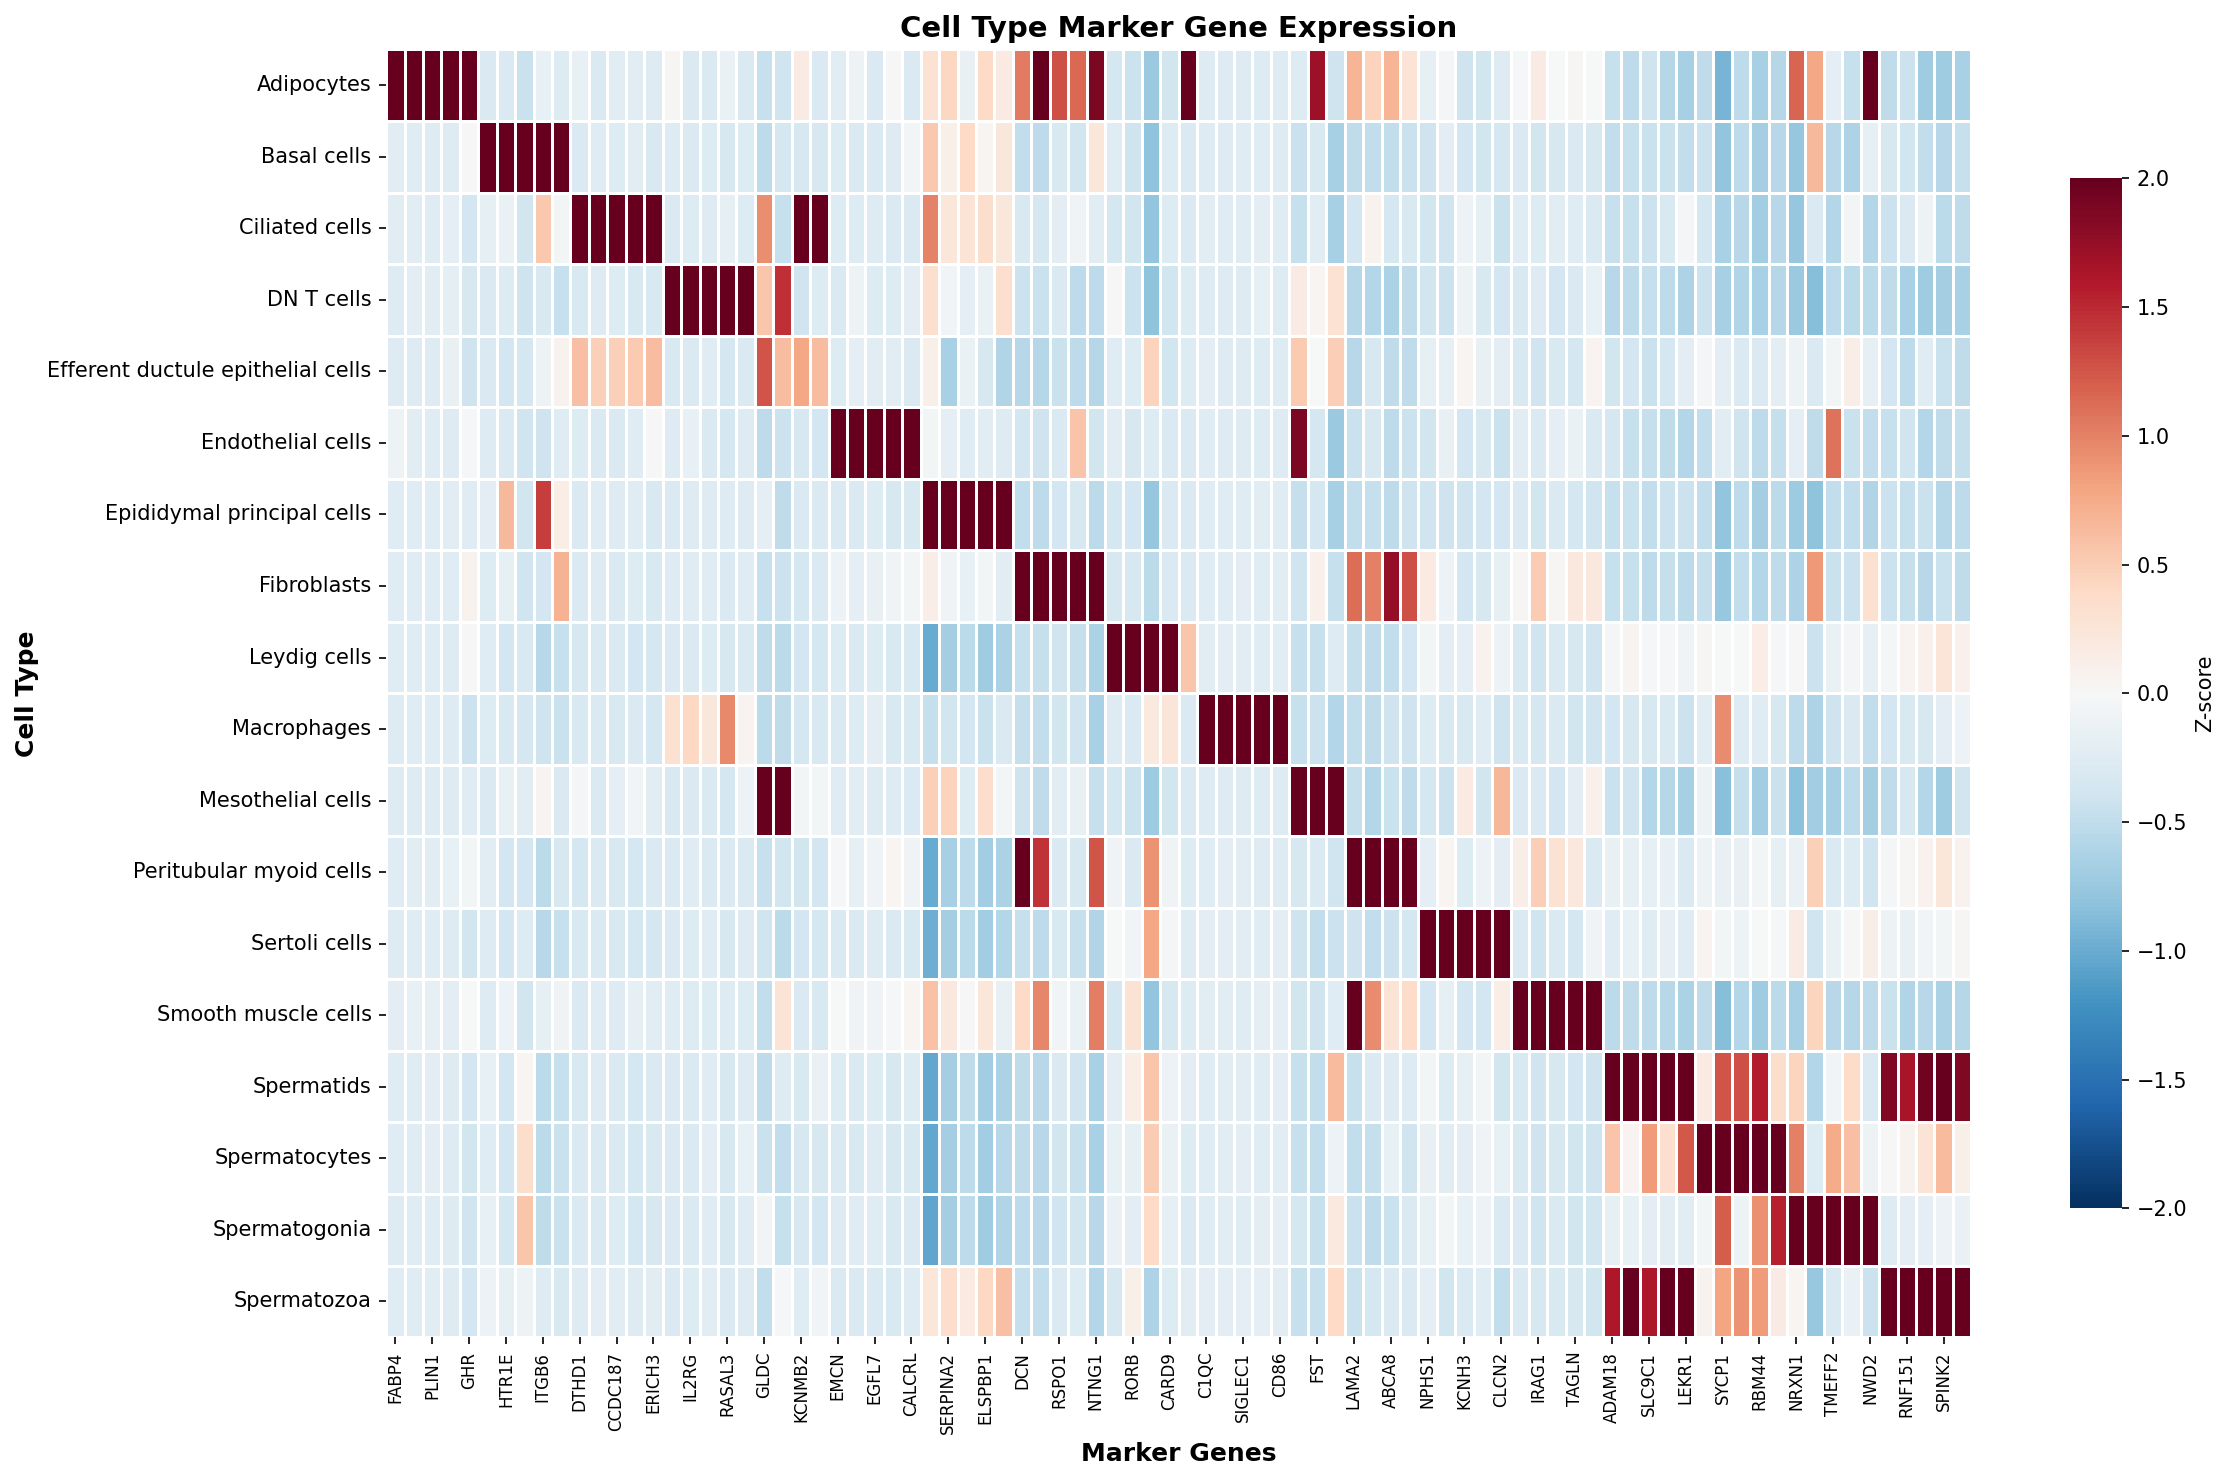
Marker Gene Expression Heatmap
🎯 Functional Enrichment Analysis
GO and KEGG pathway enrichment analysis of DEGs.
●
Found 162 enriched GO terms
●
Found 144 enriched KEGG pathways
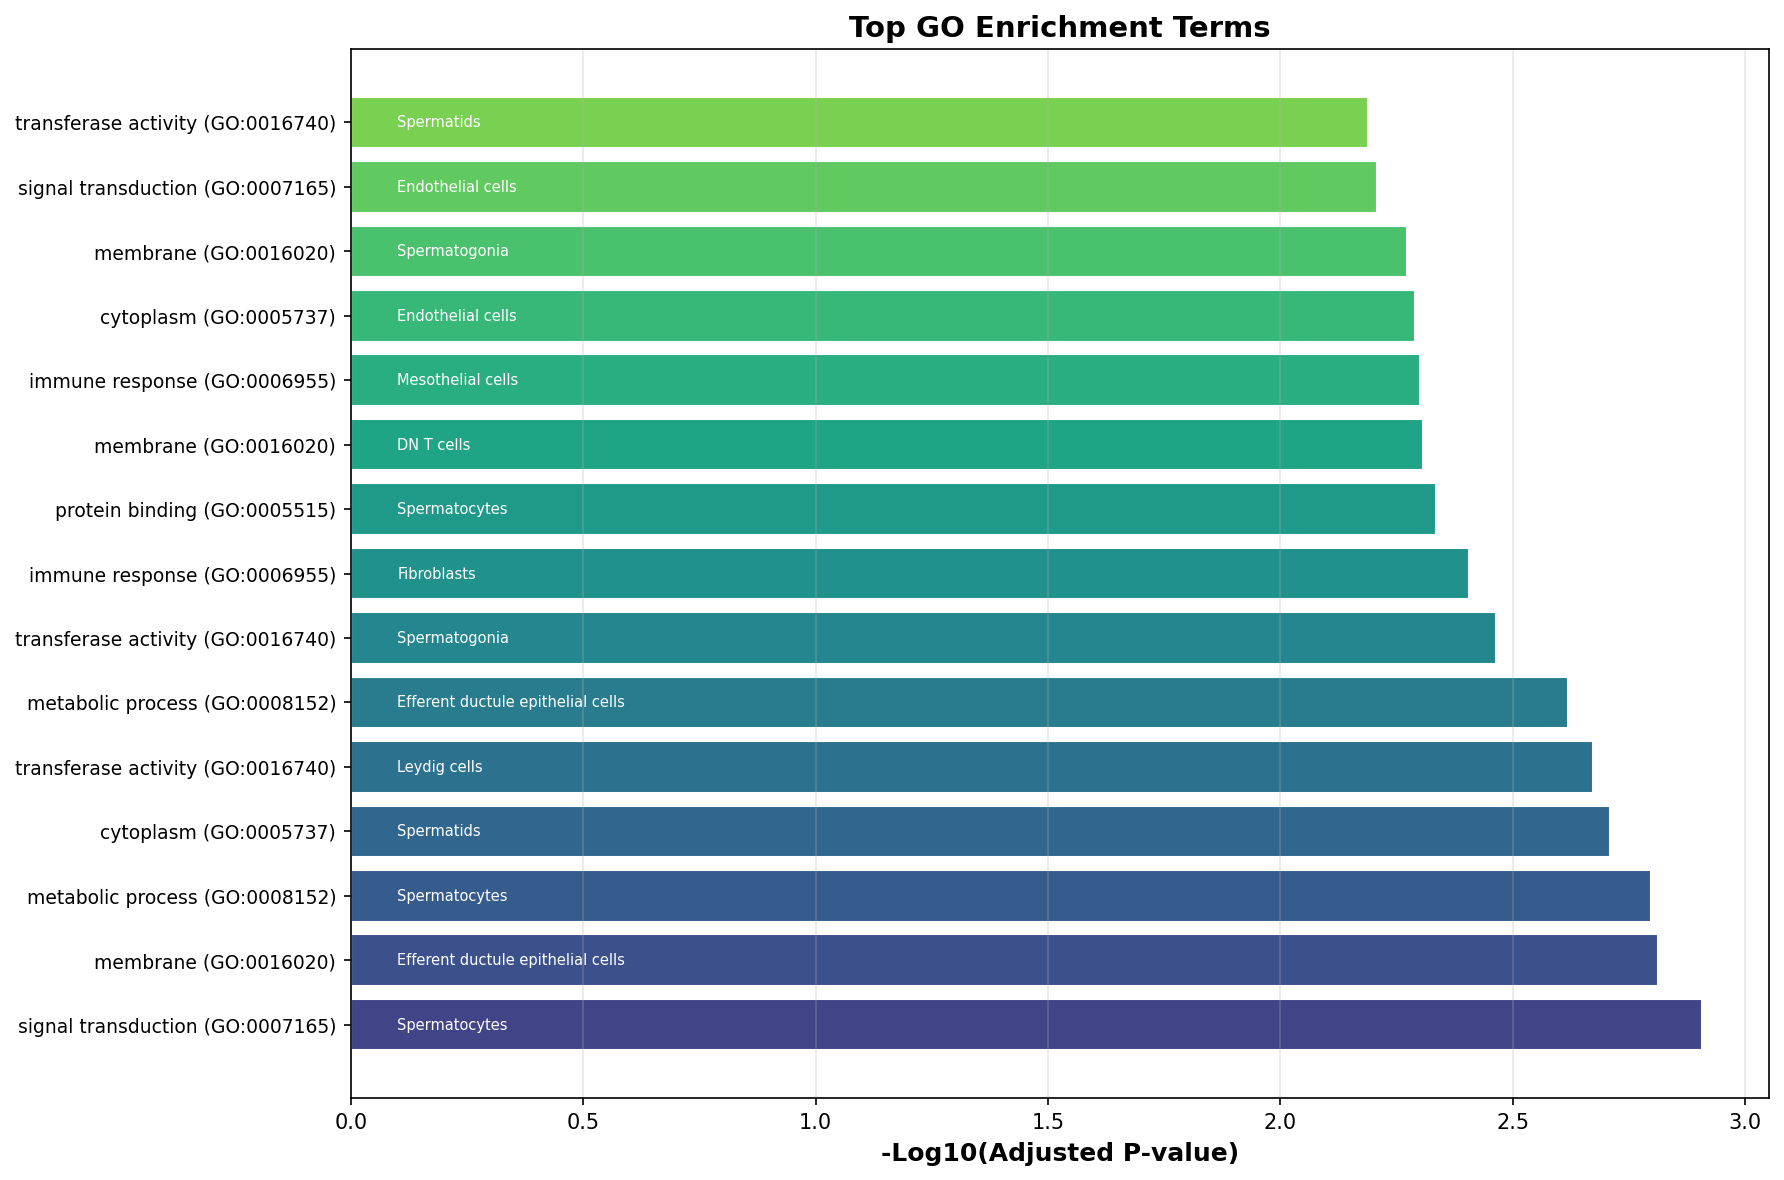
GO Enrichment
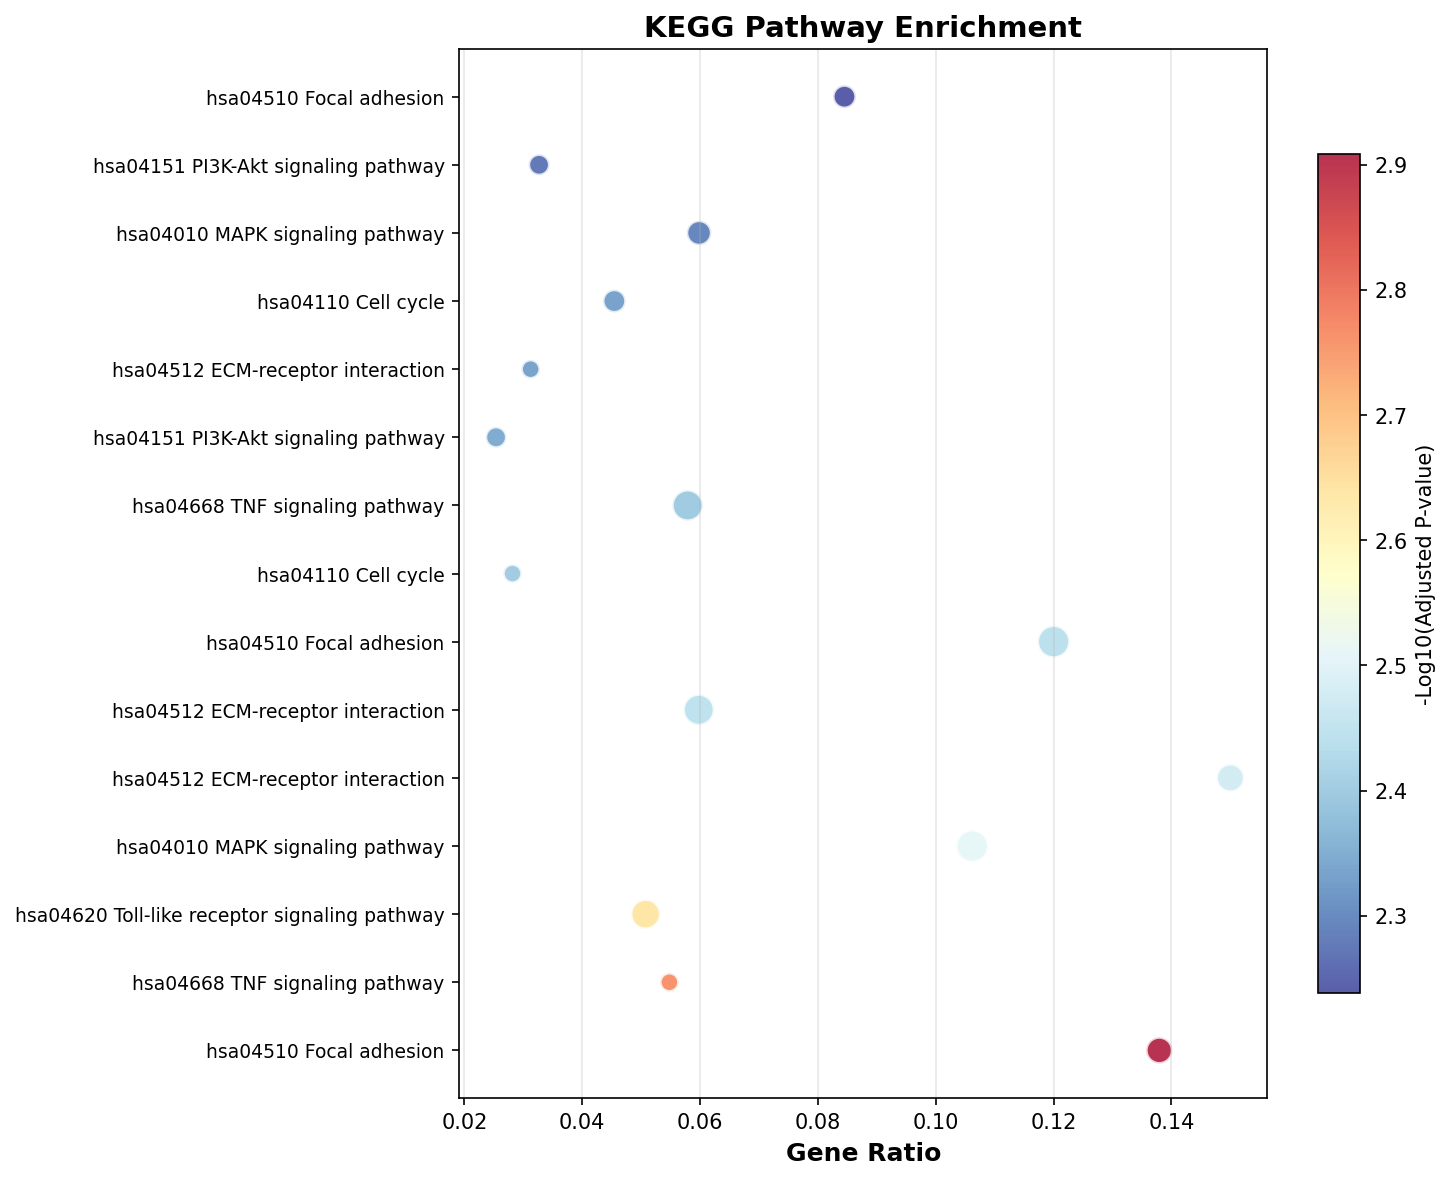
KEGG Pathway Enrichment
🏥 Disease Association Analysis
Enrichment analysis for disease-associated genes.
●
Tested 15 disease categories
●
Found 12 significant associations
Top Associated Diseases
●Systemic lupus erythematosus
●Autism spectrum disorder
●Breast cancer
●Asthma
●Asthma
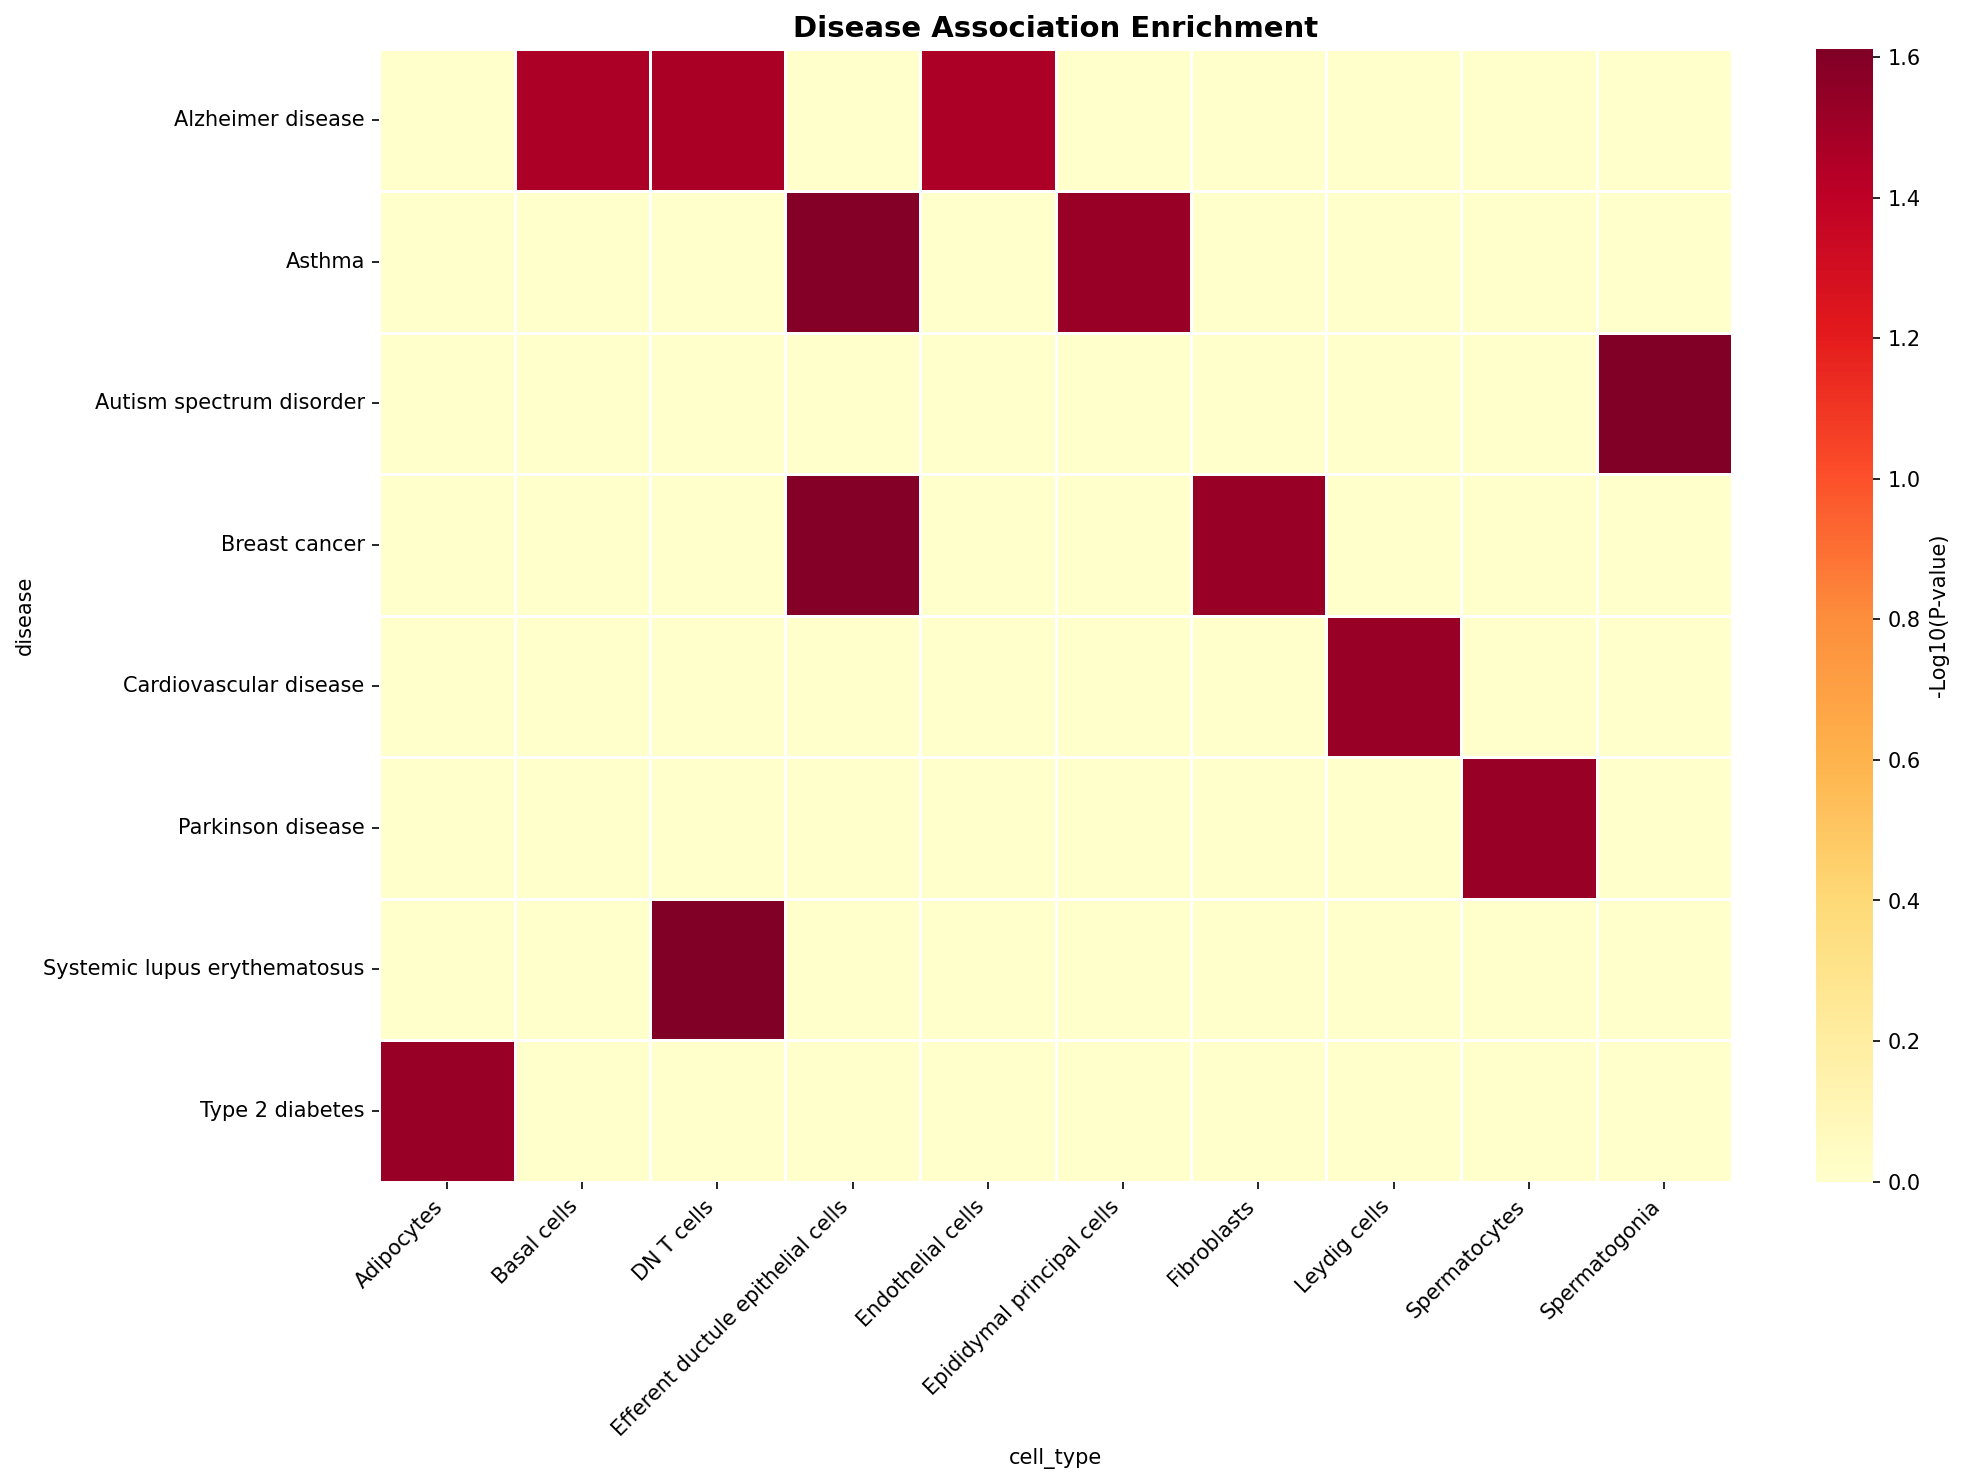
Disease Association Heatmap
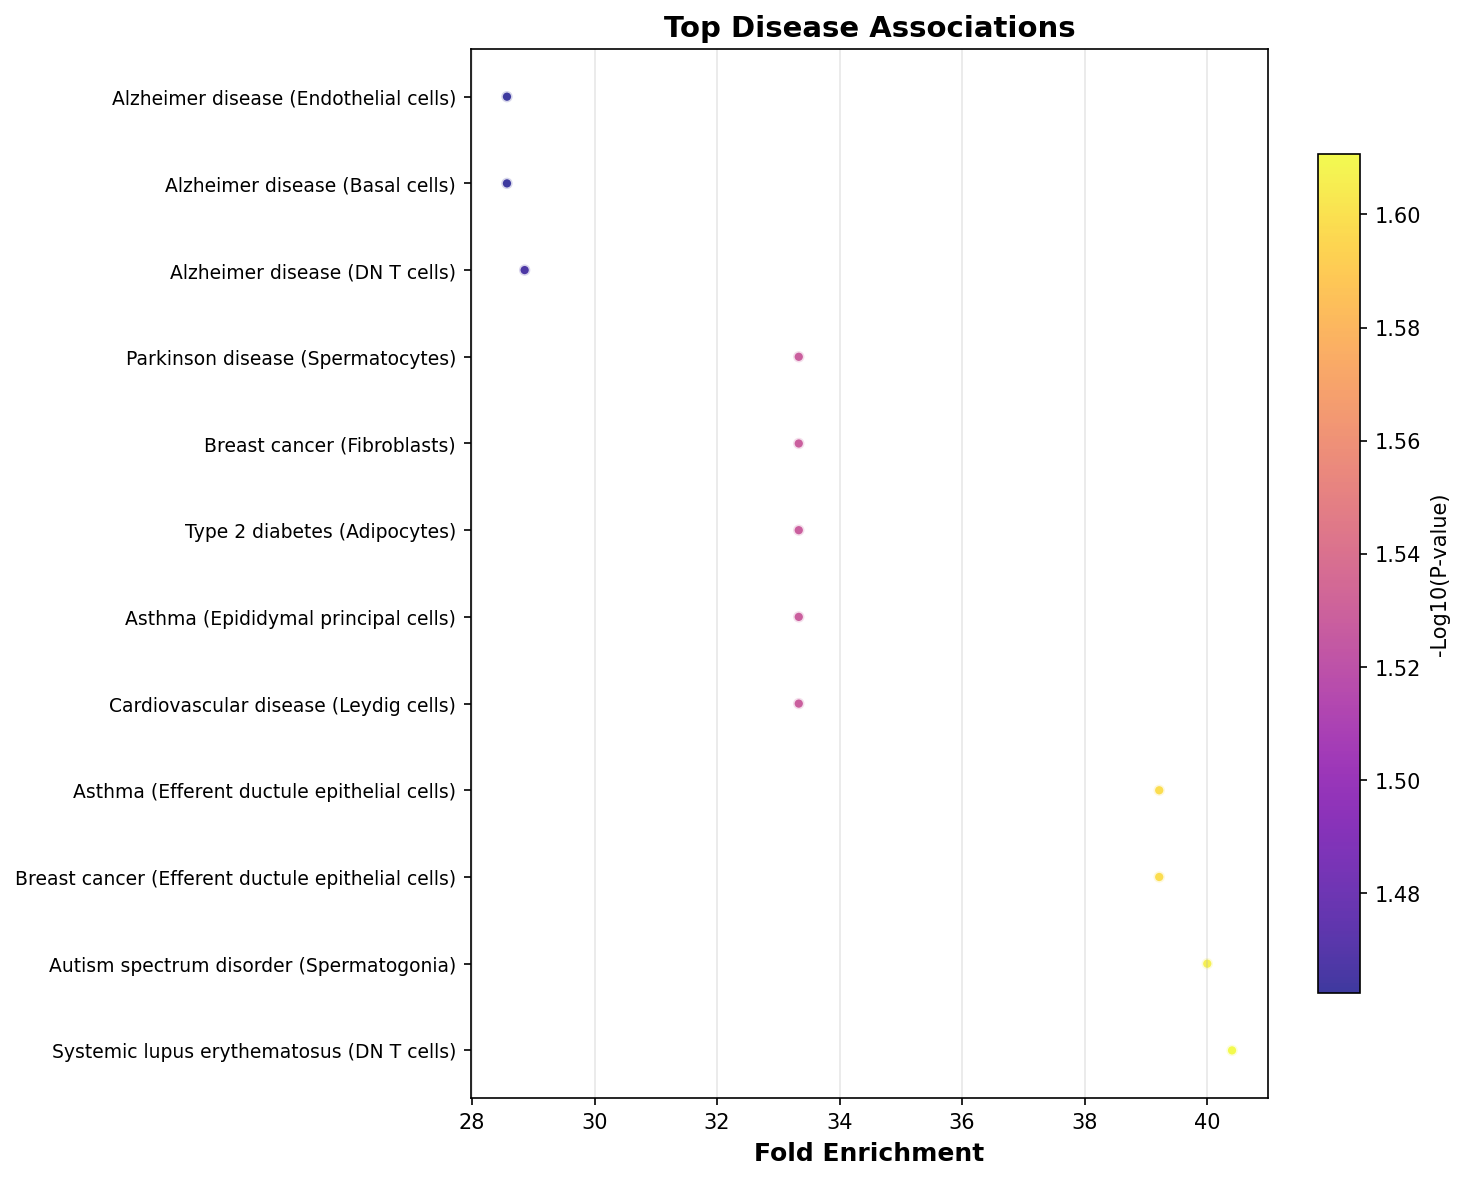
Top Disease Associations