GSE198571 Zebrafish Aging Atlas
Organism-level Microwell-seq landscape of Danio rerio from embryo to aged adult (Wang et al., Nucleic Acids Research 2023). This page uses the author ZCDL annotation (1,082,680 cells; 5 stages; 41 types / 10 lineages) and a 21-day vs 22-month differential-expression contrast streamed from GEO DGE libraries. The full count matrix stays on the compute host.
t-SNE overview
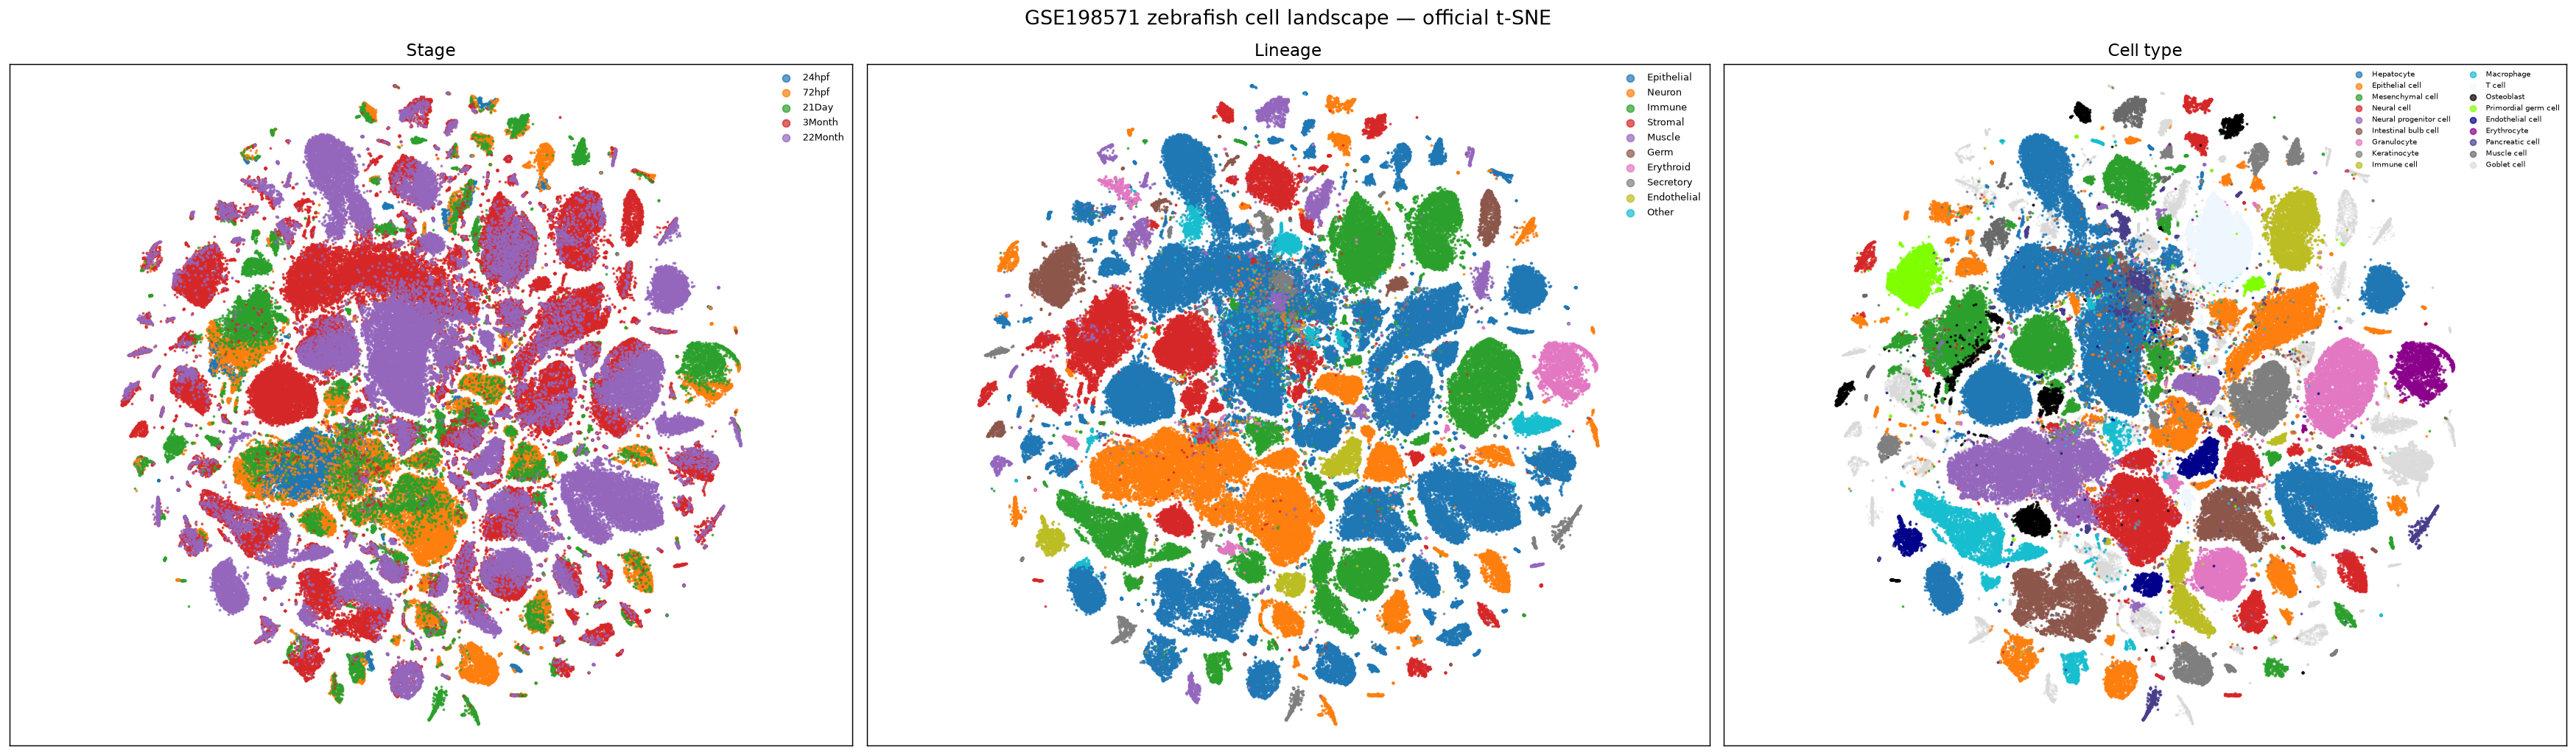
Author ZCDL embedding, subsampled for display. Left→right: stage · lineage · cell type. Fig1_scanpy.h5ad on disk is the earlier ZCL 1.0 object (217k HVG cells) and is not this aging landscape.
Stage and lineage coverage
Five chronological stages: 24 hpf, 72 hpf, 21 day, 3 month, 22 month. Adult vs aged composition below uses 3 month (Young) vs 22 month (Old).
| Stage | Cells |
|---|---|
| 24hpf | 44,771 |
| 72hpf | 158,848 |
| 21Day | 121,007 |
| 3Month | 430,420 |
| 22Month | 327,634 |
| Lineage | Cells |
|---|---|
| Epithelial | 474,911 |
| Immune | 173,910 |
| Neuron | 173,794 |
| Stromal | 119,556 |
| Muscle | 31,427 |
| Germ | 29,112 |
| Erythroid | 23,362 |
| Secretory | 20,643 |
| Endothelial | 18,051 |
| Other | 17,914 |
Lineage composition across stages
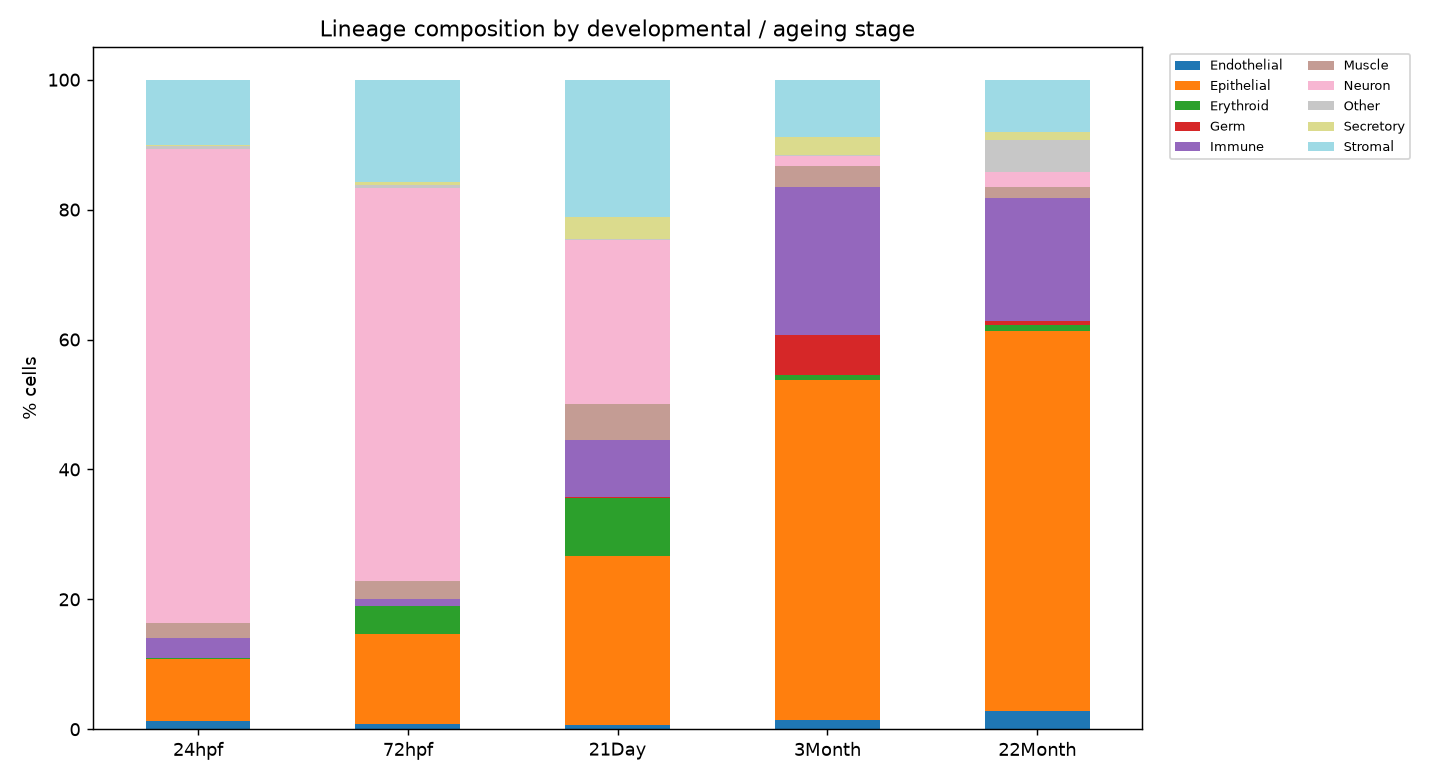
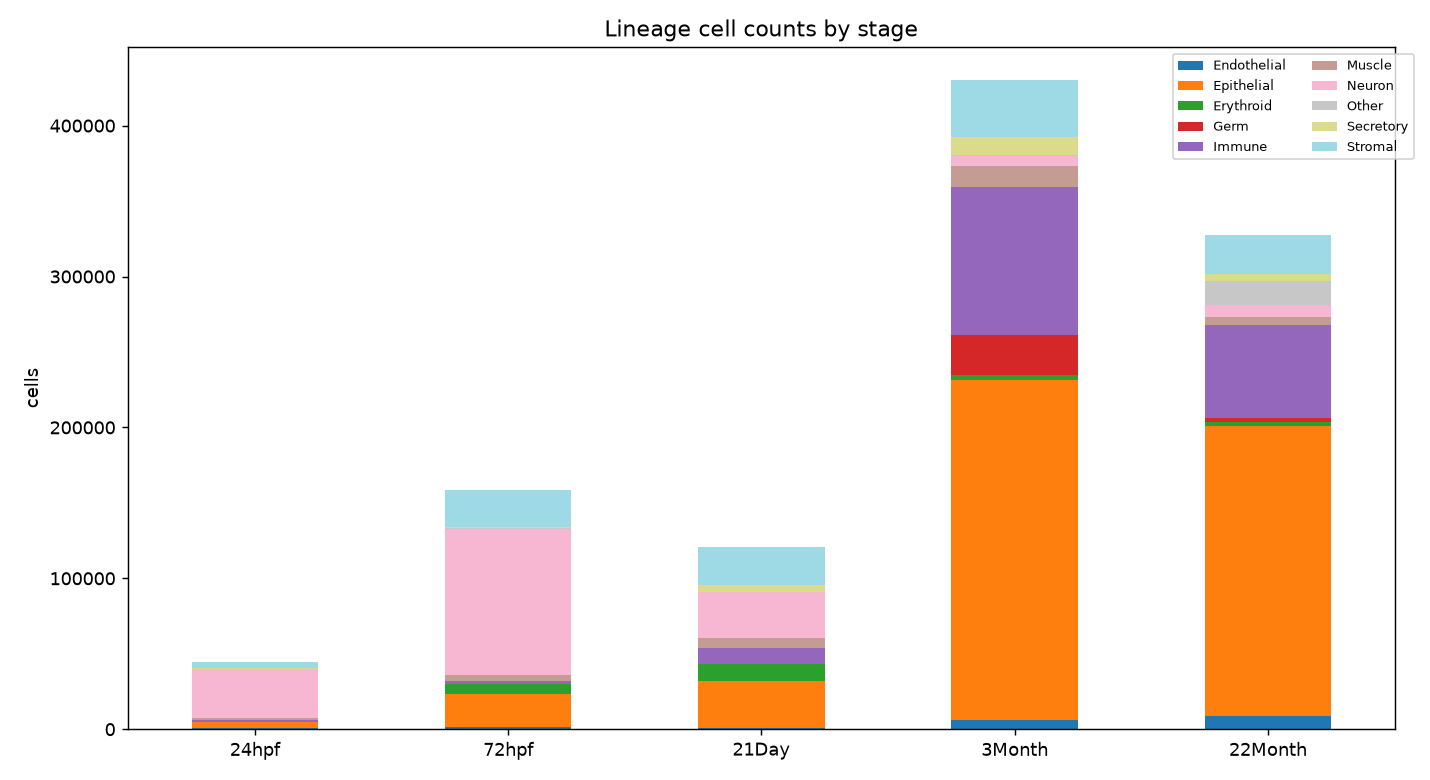
Neurons dominate early embryos/larvae; epithelial and immune compartments expand in adult and aged fish. Counts and percentages are computed on the full 1.08M ZCDL annotation.
Adult vs aged cell-type composition
Top 20 cell types in the 3-month + 22-month subset. Hepatocytes remain the largest adult/aged class; immune and epithelial fractions shift with age.
| Cell type | Young (3mo) | Old (22mo) | Total | Young % | Old % |
|---|---|---|---|---|---|
| Hepatocyte | 86,096 | 136,840 | 222,936 | 21.18 | 45.4 |
| Epithelial cell | 60,697 | 20,579 | 81,276 | 14.94 | 6.83 |
| Intestinal bulb cell | 33,107 | 21,905 | 55,012 | 8.15 | 7.27 |
| Mesenchymal cell | 29,196 | 24,559 | 53,755 | 7.18 | 8.15 |
| Granulocyte | 23,575 | 26,876 | 50,451 | 5.8 | 8.92 |
| Immune cell | 31,262 | 8,823 | 40,085 | 7.69 | 2.93 |
| Macrophage | 18,844 | 14,507 | 33,351 | 4.64 | 4.81 |
| T cell | 21,760 | 8,790 | 30,550 | 5.35 | 2.92 |
| Keratinocyte | 21,521 | 3,968 | 25,489 | 5.3 | 1.32 |
| Primordial germ cell | 17,849 | 1,432 | 19,281 | 4.39 | 0.48 |
| Endothelial cell | 6,432 | 8,950 | 15,382 | 1.58 | 2.97 |
| Goblet cell | 8,606 | 3,414 | 12,020 | 2.12 | 1.13 |
| Muscle cell | 7,018 | 3,776 | 10,794 | 1.73 | 1.25 |
| Mt-rich cell | 794 | 9,191 | 9,985 | 0.2 | 3.05 |
| Pancreatic cell | 7,664 | 1,331 | 8,995 | 1.89 | 0.44 |
| Spermatocyte | 8,800 | 23 | 8,823 | 2.17 | 0.01 |
| Mesenchymal cell (caudal fin) | 7,530 | 946 | 8,476 | 1.85 | 0.31 |
| Enterocyte | 3,851 | 3,200 | 7,051 | 0.95 | 1.06 |
| Ionocyte | 5,727 | 1,311 | 7,038 | 1.41 | 0.43 |
| Smooth muscle cell | 6,078 | 959 | 7,037 | 1.5 | 0.32 |
Differential expression — 22 month vs 21 day
Wilcoxon rank-sums on a balanced GEO Microwell-seq subsample (GEO Microwell-seq 21-day (Young) vs 22-month (Old)). Cross-stage DE is exploratory — composition shifts contribute to the signal. Status: ok.
Up in Old (22mo ↑)
| Gene | log2FC | padj |
|---|---|---|
| vtg1 | 20.56 | 0.0e+0 |
| vtg6 | 33.88 | 0.0e+0 |
| vtg7 | 33.78 | 0.0e+0 |
| rbm48 | 10.07 | 0.0e+0 |
| apoa2 | 2.02 | 0.0e+0 |
| fabp10a | 4.01 | 0.0e+0 |
| tfa | 2.83 | 0.0e+0 |
| apoc1 | 3.78 | 0.0e+0 |
| mt-co3 | 1.04 | 0.0e+0 |
| CABZ01042594.1 | 13.28 | 8.2e-301 |
| hsp70.1 | 0.9 | 3.9e-125 |
| lyz | 4.61 | 1.1e-115 |
Down in Old (22mo ↓)
| Gene | log2FC | padj |
|---|---|---|
| NC_002333.4 | -3.25 | 0.0e+0 |
| CR383676.1 | -3.25 | 0.0e+0 |
| mt-nd4 | -2.39 | 0.0e+0 |
| krt5 | -3.93 | 0.0e+0 |
| prss1 | -7.12 | 0.0e+0 |
| ela2 | -10.23 | 0.0e+0 |
| mt-cyb | -1.34 | 0.0e+0 |
| ctrb1 | -8.88 | 0.0e+0 |
| prss59.1 | -7.71 | 0.0e+0 |
| hbae3 | -10.01 | 0.0e+0 |
| prss59.2 | -8.77 | 0.0e+0 |
| zgc:92041 | -8.49 | 0.0e+0 |
Source and related views
ZCDL.rdata (2.6G) and Fig1_scanpy.h5ad (3.4G) stay on pandora002. Companion tissue-focused GEO sets in the same folder (GSE197673 brain immune; GSE275361 testis) are not this card. Existing SP084 tissue cards (PMID 34660600 ZCL 1.0) are left untouched.
Open LACA data card ↗ Open zebrafish species view ↗ GEO GSE198571 ↗ ZCL portal ↗