⚙ How is this computed? Methods: Cross-Species Comparison
Longevity & Aging · Cell 2023

Longevity RNA-seq profiles

Gene-level counts from Tyshkovskiy et al., Cell 2023 (GSE227359, 48 samples; GSE227358, 42 samples). Displayed values are raw counts and matrix-total CPM computed from those GEO matrices.

Bulk tissue RNA-seq GSE227359 · 48 samples GSE227358 · 42 samples Exact gene lookup Raw count + matrix-total CPM NCBI Gene annotation
371mammalian biological samples integrated in the study
41mammalian species in the integrated analysis
6tissues represented study-wide
13,784one-to-one orthologs in the paper's analysis set
Scope

Paper-wide set versus the two GEO matrices

The paper’s integrated analysis used 371 samples / 41 species / 13,784 orthologs. Tables on this page use only GSE227359 or GSE227358, labeled as such.

Paper-wide integration

Comparative longevity, intervention, and aging signatures

Newly sequenced samples were integrated with public RNA-seq datasets to characterize longevity-associated expression across species, lifespan-extending interventions in mouse, and mammalian aging. The set of 13,784 one-to-one orthologs pertains to this harmonized analytical workflow—not to the row dimension of either GEO file displayed here.

371mammalian samples
41mammalian species
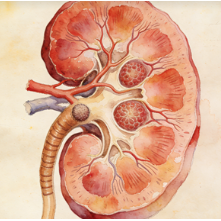
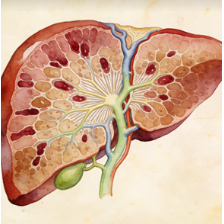
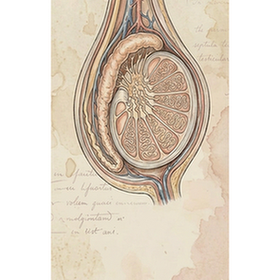
6brain, cerebellum, heart, kidney, liver, testis
13,784analysis orthologs
GSE227359 · displayed
48sample columns
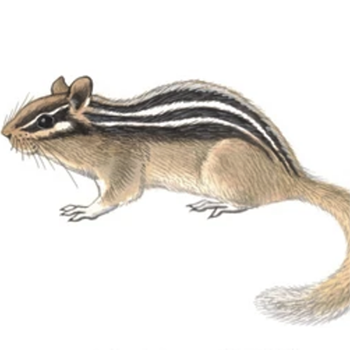
New cross-species tissue RNA-seq

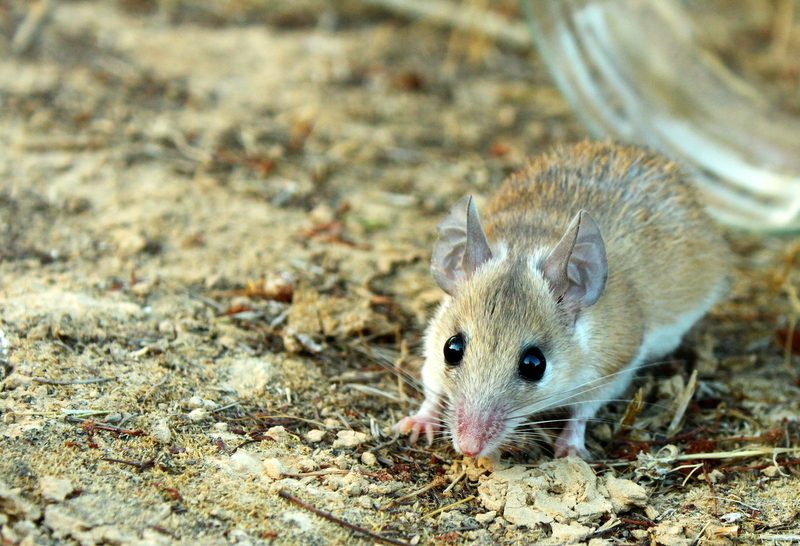
Young-adult tissue samples from eight mammalian species spanning brain, cerebellum, kidney, and liver. The corresponding processed matrix comprises 16,816 rows indexed by mouse Ensembl ortholog identifiers.

8species
4tissues
16,816matrix rows
RawGEO-supplied counts
GSE227358 · displayed
42sample columns

Mouse compound-intervention RNA-seq

Hepatic and renal expression profiles following administration of predicted longevity compounds. The matrix comprises 12 liver treatment columns and 30 kidney columns, including six kidney control samples.

12liver treatment samples
30kidney samples
43,629matrix rows
6kidney controls
Live data explorer

Inspect a deposited gene profile

Provide an exact mouse Ensembl gene identifier or NCBI Gene symbol. The server parses the selected official GEO supplementary count matrix, returns sample-level integer counts, and derives matrix-total CPM from the column-wise sum of the published gene rows. Filtering operations never modify the underlying source files.

Loading RNA-seq metadata…

Selected gene

NCBI Gene annotation will appear here.

Group means appear after the matrix query.

Sample-level values

Source counts together with the published-matrix column sum, matrix-total CPM, and the corresponding log2 transformation.

Scroll horizontally to inspect every measurement column.

Sample-level gene expression values for the selected RNA-seq dataset and filters.
Sample Species / treatment Tissue Replicate Raw count Matrix column sum Matrix-total CPM log2(CPM + 1)
Loading…
Transparent calculation

What LACA computes—and what it does not

Every displayed transformation is fully reproducible from the downloadable GEO matrix. The browser applies no batch correction, causal inference, or re-implementation of the publication's statistical model.

1

Read the deposited integer count

The submitted Ensembl identifier is matched exactly against the selected gzip-compressed GEO file. Sample labels are validated against a locally generated metadata index before values are returned.

2

Calculate the matrix column sum

LACA sums every published gene row within the selected matrix column and computes CPM = raw count / matrix column sum × 1,000,000. The logarithmic view is log2(CPM + 1). This denominator does not correspond to the total read count of the original sequencing library.

3

Keep inference outside this browser

Group bars denote arithmetic means of the currently filtered sample values and are strictly descriptive: no covariate model, ortholog-length correction, multiple-testing procedure, or fold-change test is applied.

Primary sources & provenance

Trace every layer back to its source

The external links below resolve to the primary article and the official NCBI records underlying this page.