Kedlian Human SKM Aging
Human skeletal-muscle ageing atlas (Kedlian et al., Nature Aging 2024).
This page uses the official CellGeni object
SKM_human_pp_cells2nuclei_2023-06-22.h5ad:
183,161 profiles (90,902 cells + 92,259 nuclei) × 29,400 genes,
17 donors, official UMAP and 36 level-0 labels.
Numbers below are counted on that object. The 1.9 G matrix stays on the compute host.
UMAP overview
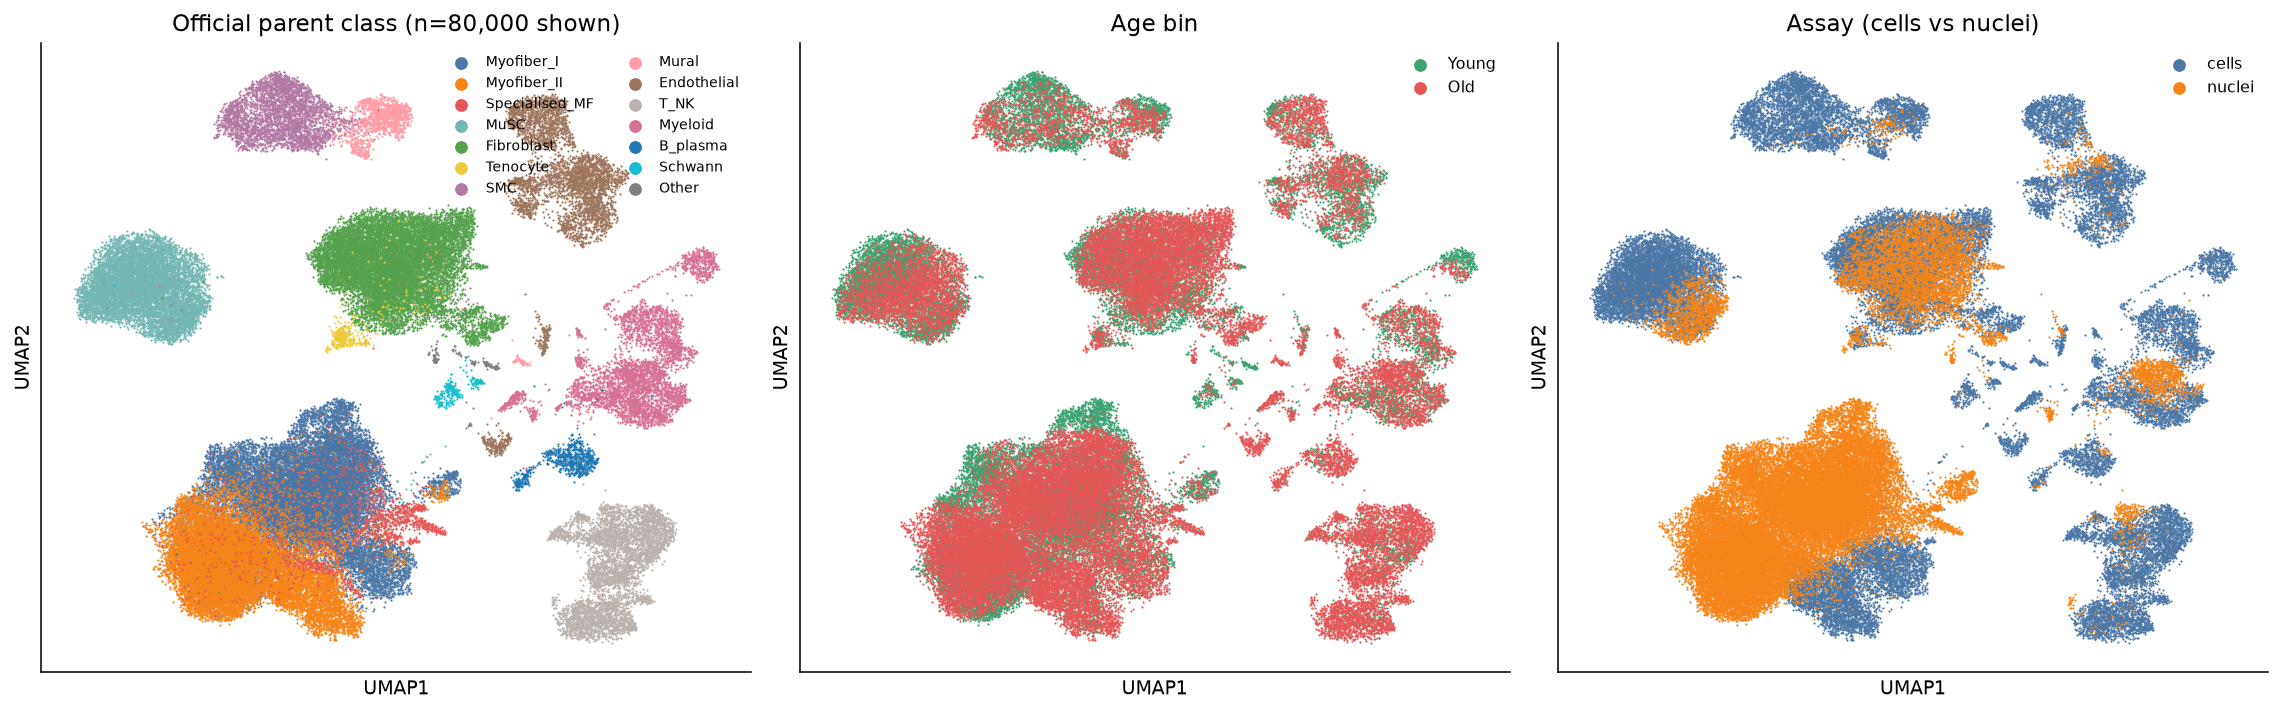
Official CellGeni UMAP (not re-embedded). Left: collapsed parent class. Middle: young vs old. Right: cells vs nuclei. Scatter shows a random 80k subset.
Donors and parent classes
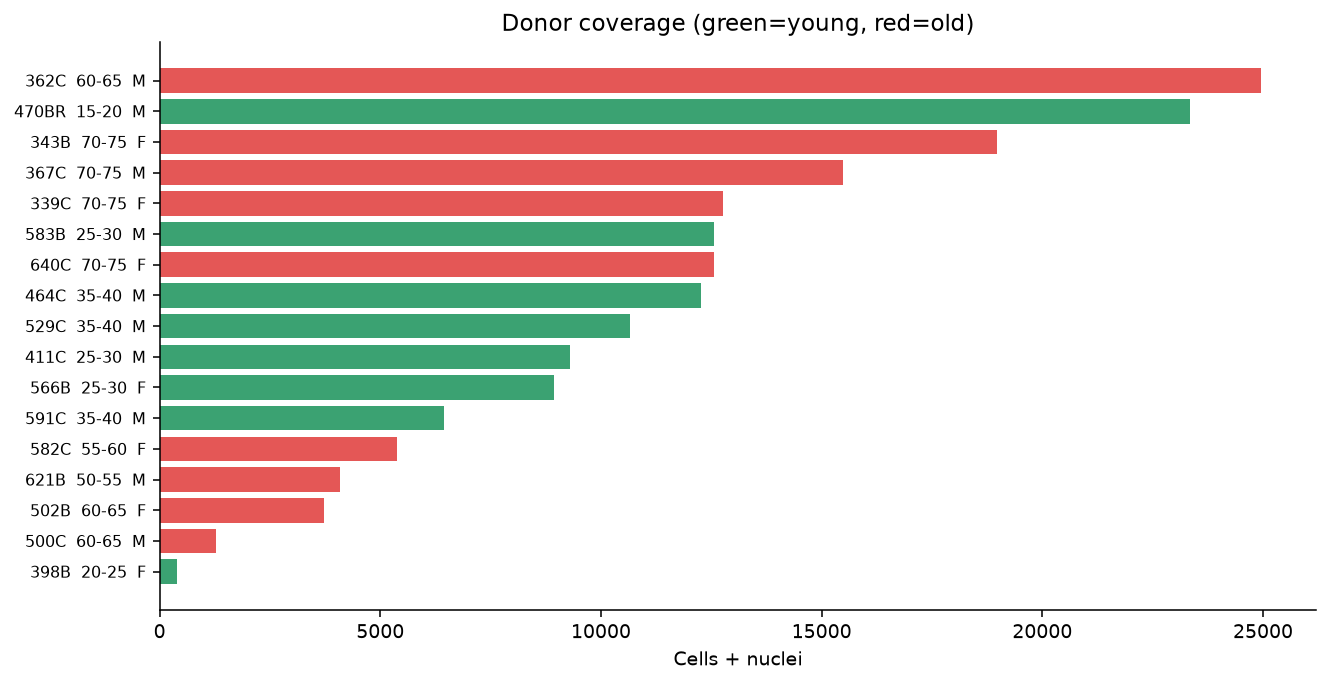
Age bins are the official Age_bin labels (young = 15–40 y; old = 50–75 y).
Assay mix is nearly even: 90,902 cells /
92,259 nuclei.
Sex is unbalanced (M 120,405 /
F 62,756), so sex-linked genes such as XIST
are not read as ageing markers.
| Donor | Age group | Bin | Sex | Profiles |
|---|---|---|---|---|
| 621B | 50-55 | old | M | 4,093 |
| 582C | 55-60 | old | F | 5,374 |
| 362C | 60-65 | old | M | 24,961 |
| 500C | 60-65 | old | M | 1,284 |
| 502B | 60-65 | old | F | 3,731 |
| 339C | 70-75 | old | F | 12,771 |
| 343B | 70-75 | old | F | 18,980 |
| 367C | 70-75 | old | M | 15,487 |
| 640C | 70-75 | old | F | 12,559 |
| 470BR | 15-20 | young | M | 23,345 |
| 398B | 20-25 | young | F | 398 |
| 411C | 25-30 | young | M | 9,288 |
| 566B | 25-30 | young | F | 8,943 |
| 583B | 25-30 | young | M | 12,571 |
| 464C | 35-40 | young | M | 12,267 |
| 529C | 35-40 | young | M | 10,668 |
| 591C | 35-40 | young | M | 6,441 |
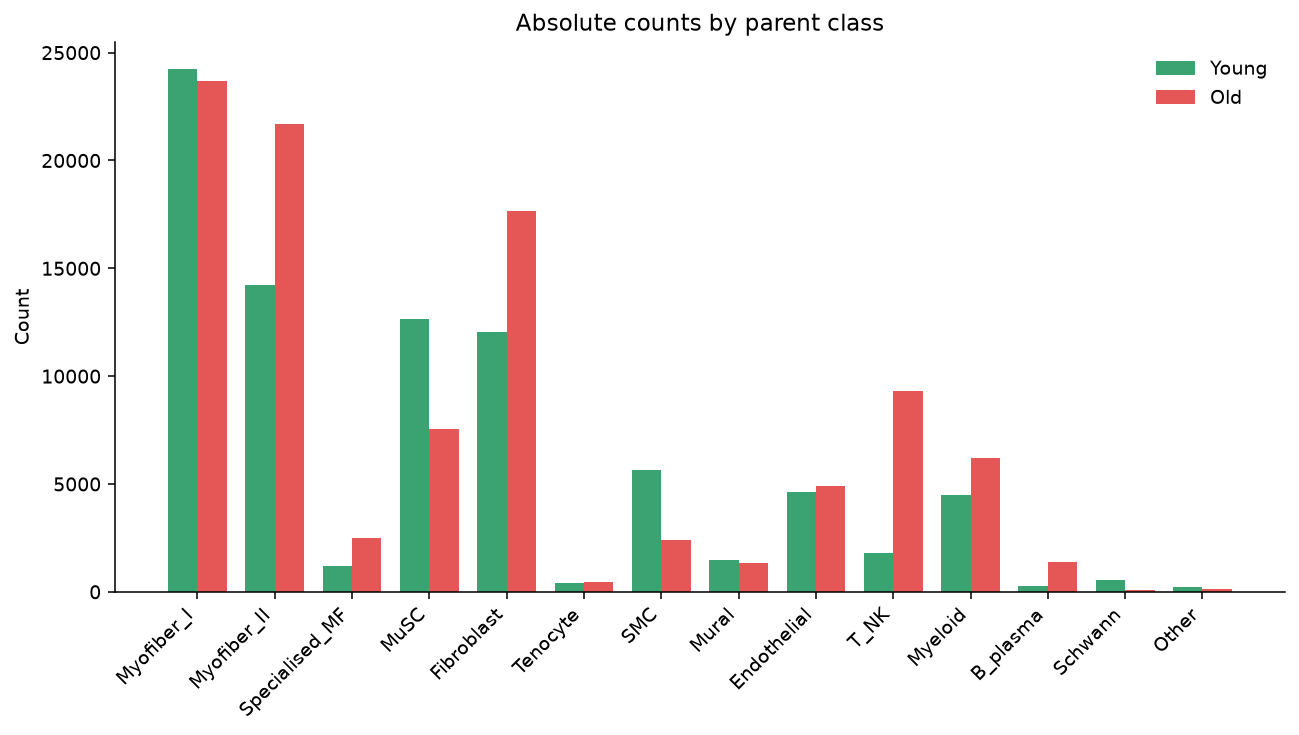
| Parent class | Total | Young % | Old % |
|---|---|---|---|
| Myofiber_I | 47,932 | 28.9 | 23.9 |
| Myofiber_II | 35,891 | 16.9 | 21.8 |
| Specialised_MF | 3,699 | 1.4 | 2.5 |
| MuSC | 20,215 | 15.1 | 7.6 |
| Fibroblast | 29,701 | 14.3 | 17.8 |
| Tenocyte | 864 | 0.5 | 0.5 |
| SMC | 8,049 | 6.7 | 2.4 |
| Mural | 2,797 | 1.8 | 1.3 |
| Endothelial | 9,508 | 5.5 | 4.9 |
| T_NK | 11,110 | 2.2 | 9.4 |
| Myeloid | 10,704 | 5.3 | 6.3 |
| B_plasma | 1,656 | 0.3 | 1.4 |
| Schwann | 669 | 0.7 | 0.1 |
| Other | 366 | 0.3 | 0.1 |
 Open LACA data card
Back to Aging Atlas
Nature Aging ↗
Open LACA data card
Back to Aging Atlas
Nature Aging ↗
Old vs Young composition
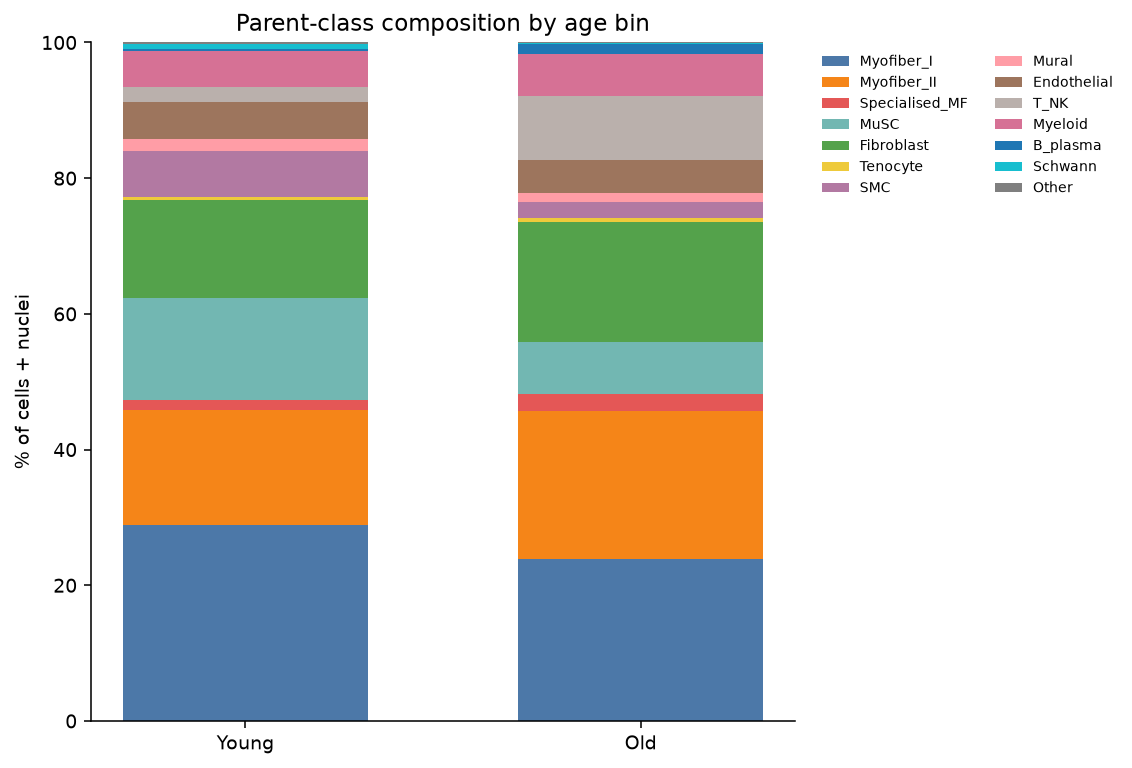
Measured shift on official labels: MuSC 15.1% → 7.6%; SMC 6.7% → 2.4%; T/NK 2.2% → 9.4%; immune lineage 7.8% → 17.0%. Combined myofiber share stays ~47–48%.
| Age | Profiles | Myofiber % | MuSC % | FB % | Immune % | T/NK % | SMC % |
|---|---|---|---|---|---|---|---|
| Young | 83,921 | 47.3 | 15.1 | 14.3 | 7.8 | 2.2 | 6.7 |
| Old | 99,240 | 48.2 | 7.6 | 17.8 | 17.0 | 9.4 | 2.4 |
MuSC subtypes
Official annotation_level2 inside the MuSC compartment of the integrated object (20,215 profiles).
| Subtype | Young | Old | Total |
|---|---|---|---|
| ICAM1+MuSCs | 1,489 | 481 | 1,970 |
| MYOG+MuSCs | 68 | 37 | 105 |
| MuSC | 10,069 | 6,169 | 16,238 |
| TNFRSF12A+MuSCs | 1,045 | 857 | 1,902 |
Differential expression — Old vs Young
Wilcoxon on a balanced 8,000 + 8,000 subsample of the integrated object (HVG). Whole-atlas Old↑ is dominated by immune genes (IL32, CD69, CD52, CCL5) plus myofiber identity genes — consistent with the T/NK share rising from 2.2% to 9.4%. This is a composition-aware contrast, not a purified-cell test.
Up in Old (aged ↑)
| Gene | log2FC | padj |
|---|---|---|
| IL32 | 1.3 | 8.1e-37 |
| PPDPFL | 1.55 | 4.0e-34 |
| CSRP3 | 0.85 | 1.2e-15 |
| TNNC2 | 0.96 | 1.9e-13 |
| MYL1 | 1.23 | 3.8e-13 |
| TCAP | 0.76 | 5.6e-13 |
| CD69 | 2.1 | 2.4e-12 |
| CD52 | 1.87 | 4.5e-12 |
| PTPRC | 1.26 | 1.7e-11 |
| HCST | 1.6 | 2.5e-10 |
| SLC2A3 | 0.59 | 4.3e-9 |
| CCL5 | 2.55 | 5.0e-9 |
Down in Old (aged ↓)
| Gene | log2FC | padj |
|---|---|---|
| MT1X | -1.33 | 7.9e-151 |
| SPARCL1 | -1.59 | 6.5e-111 |
| PPARGC1A | -1.92 | 1.8e-72 |
| SLC38A1 | -1.73 | 1.2e-68 |
| CADM2 | -1.35 | 2.4e-62 |
| TTTY14 | -1.74 | 2.9e-55 |
| ABLIM1 | -0.98 | 2.1e-51 |
| MYOM2 | -1.97 | 1.2e-48 |
| RRAD | -1.32 | 3.1e-47 |
| MT1M | -1.35 | 6.7e-45 |
| MIR133A1HG | -1.45 | 8.1e-42 |
| YBX3 | -0.43 | 4.1e-35 |
MuSC-only Old vs Young
Same test restricted to official MuSC. XIST tops the Old↑ list because several large old donors are female — do not treat it as a stem-cell ageing gene. Measured Old↓ includes IGFBP5, FKBP5 and metallothioneins.
| Gene ↑ Old | log2FC | padj |
|---|---|---|
| XIST | 4.65 | 3.0e-156 |
| DEPP1 | 1.1 | 6.0e-43 |
| MGP | 0.78 | 9.7e-36 |
| FABP5 | 1.61 | 5.6e-32 |
| MEG3 | 0.32 | 3.0e-28 |
| PRUNE2 | 2.51 | 7.5e-28 |
| ACTA1 | 1.94 | 1.0e-24 |
| TAGLN | 2.23 | 2.3e-21 |
| Gene ↓ Old | log2FC | padj |
|---|---|---|
| IGFBP5 | -1.05 | 1.6e-176 |
| FKBP5 | -1.65 | 4.8e-176 |
| MT1X | -1.03 | 2.7e-143 |
| MT1M | -1.57 | 2.6e-136 |
| DNAJB1 | -1.04 | 2.1e-125 |
| MT2A | -1.12 | 2.0e-120 |
| HSP90AA1 | -0.84 | 3.9e-110 |
| LPL | -1.93 | 1.1e-98 |
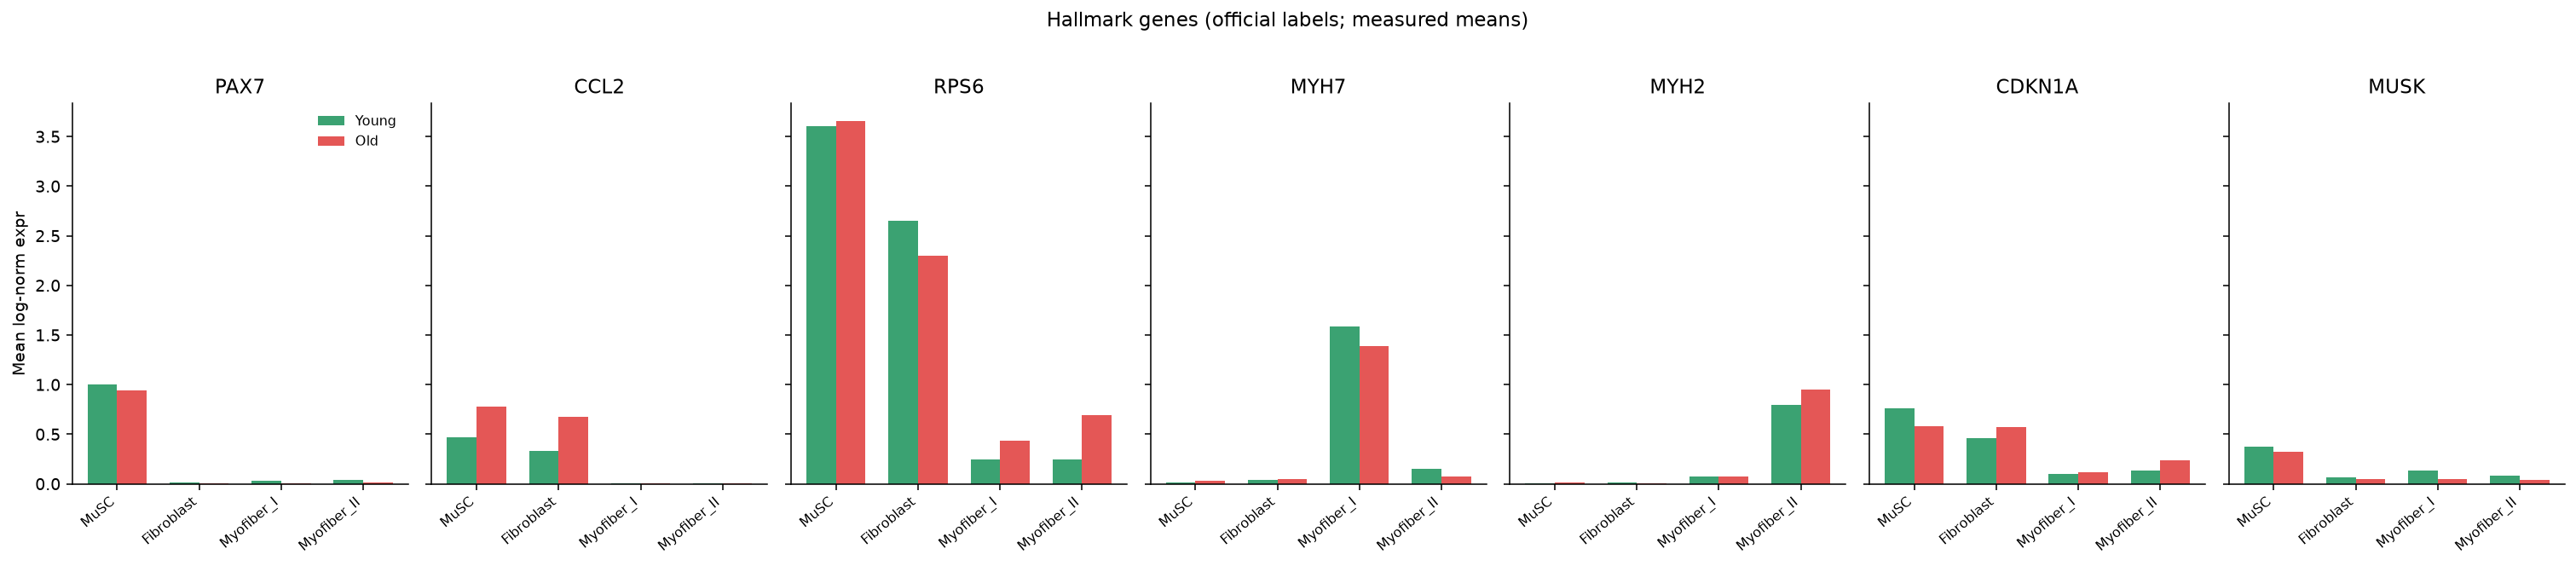
Hallmark genes (measured means)
Mean log-normalised expression on official parent labels. CCL2 in MuSC rises 0.47 → 0.77 (matches the paper’s chemokine claim). Ribosomal genes RPS6/RPL13A in MuSC stay high in both bins on this object — the page does not invent a “ribosome collapse” from these means.
| Age | Cell type | n | PAX7 | CCL2 | RPS6 | MYH7 | MYH2 | MUSK | CDKN1A |
|---|---|---|---|---|---|---|---|---|---|
| Young | MuSC | 6,504 | 0.999 | 0.471 | 3.6 | 0.014 | 0.009 | 0.372 | 0.757 |
| Young | Fibroblast | 6,266 | 0.016 | 0.335 | 2.651 | 0.043 | 0.013 | 0.066 | 0.464 |
| Young | Myofiber_I | 12,719 | 0.03 | 0.008 | 0.249 | 1.581 | 0.077 | 0.131 | 0.101 |
| Young | Myofiber_II | 7,447 | 0.035 | 0.002 | 0.247 | 0.147 | 0.799 | 0.082 | 0.136 |
| Young | Endothelial | 2,411 | 0.008 | 0.998 | 2.941 | 0.037 | 0.014 | 0.006 | 0.902 |
| Young | Myeloid | 2,322 | 0.002 | 0.165 | 2.325 | 0.024 | 0.006 | 0.004 | 0.757 |
| Old | MuSC | 3,926 | 0.941 | 0.774 | 3.652 | 0.033 | 0.014 | 0.326 | 0.576 |
| Old | Fibroblast | 9,147 | 0.003 | 0.676 | 2.297 | 0.047 | 0.009 | 0.05 | 0.575 |
| Old | Myofiber_I | 12,302 | 0.009 | 0.002 | 0.438 | 1.391 | 0.076 | 0.049 | 0.114 |
| Old | Myofiber_II | 11,203 | 0.012 | 0.001 | 0.688 | 0.073 | 0.953 | 0.04 | 0.233 |
| Old | Endothelial | 2,517 | 0.002 | 1.118 | 3.371 | 0.04 | 0.007 | 0 | 1.203 |
| Old | Myeloid | 3,236 | 0.002 | 0.495 | 2.165 | 0.048 | 0.015 | 0.003 | 0.536 |
Official level-0 labels
36 CellGeni annotation_level0 labels. Parent classes above collapse
myofiber subtypes, fibroblast compartments, endothelium and immune lineages.
| Level-0 | Young | Old | Total |
|---|---|---|---|
| MF-I | 22,110 | 19,942 | 42,052 |
| MF-II | 12,940 | 15,618 | 28,558 |
| FB | 11,485 | 16,440 | 27,925 |
| MuSC | 12,671 | 7,544 | 20,215 |
| SMC | 5,663 | 2,386 | 8,049 |
| T-cell | 1,371 | 6,014 | 7,385 |
| MF-IIsc(fg) | 1,102 | 5,973 | 7,075 |
| MF-Isc(fg) | 1,667 | 3,538 | 5,205 |
| Macrophage | 1,643 | 3,080 | 4,723 |
| NK-cell | 436 | 3,289 | 3,725 |
| CapEC | 1,718 | 1,643 | 3,361 |
| Specialised MF | 974 | 2,311 | 3,285 |
| Monocyte | 1,445 | 1,545 | 2,990 |
| VenEC | 1,093 | 1,746 | 2,839 |
| Pericyte | 1,478 | 1,319 | 2,797 |
| ArtEC | 1,661 | 878 | 2,539 |
| B-cell | 219 | 1,107 | 1,326 |
| cDC2 | 527 | 631 | 1,158 |
| Neutrophil | 706 | 269 | 975 |
| PnFB | 179 | 755 | 934 |
| Tenocyte | 401 | 463 | 864 |
| EnFB | 373 | 469 | 842 |
| LymphEC | 150 | 619 | 769 |
| MF-Isn(fg) | 485 | 190 | 675 |
| Mast | 128 | 503 | 631 |
| mSchwann | 430 | 56 | 486 |
| Hyb | 229 | 185 | 414 |
| B-plasma | 36 | 294 | 330 |
| MF-IIsn(fg) | 176 | 82 | 258 |
| Mesothelium | 199 | 4 | 203 |
| nmSchwann | 139 | 44 | 183 |
| cDC1 | 39 | 113 | 152 |
| Adipocyte | 45 | 92 | 137 |
| pDC | 0 | 39 | 39 |
| Eosinophil | 1 | 35 | 36 |
| RBC | 2 | 24 | 26 |
Source and related views
Source object on pandora002:
/mnt/disk1/LACA/kedlian_skm_38622407/SKM_human_pp_cells2nuclei_2023-06-22.h5ad (1.9 G).
Niche objects (MuSC / immune / FB-Schwann / endothelium-SMC / myonuclei) stay there and are not copied to the web root.
Existing human muscle cards Data0247 / Data0248 are unchanged.