Tabula Muris Senis Mouse Ageing Atlas
Whole-body single-cell transcriptomic atlas of ageing mouse tissues (Tabula Muris Consortium, Nature 2020). This page summarises the official complete object: 23 tissues, six chronological ages (1–30 months), cell-type composition along the ageing axis, and a young (1/3/18 m) vs old (21/24/30 m) differential-expression contrast.
UMAP overview
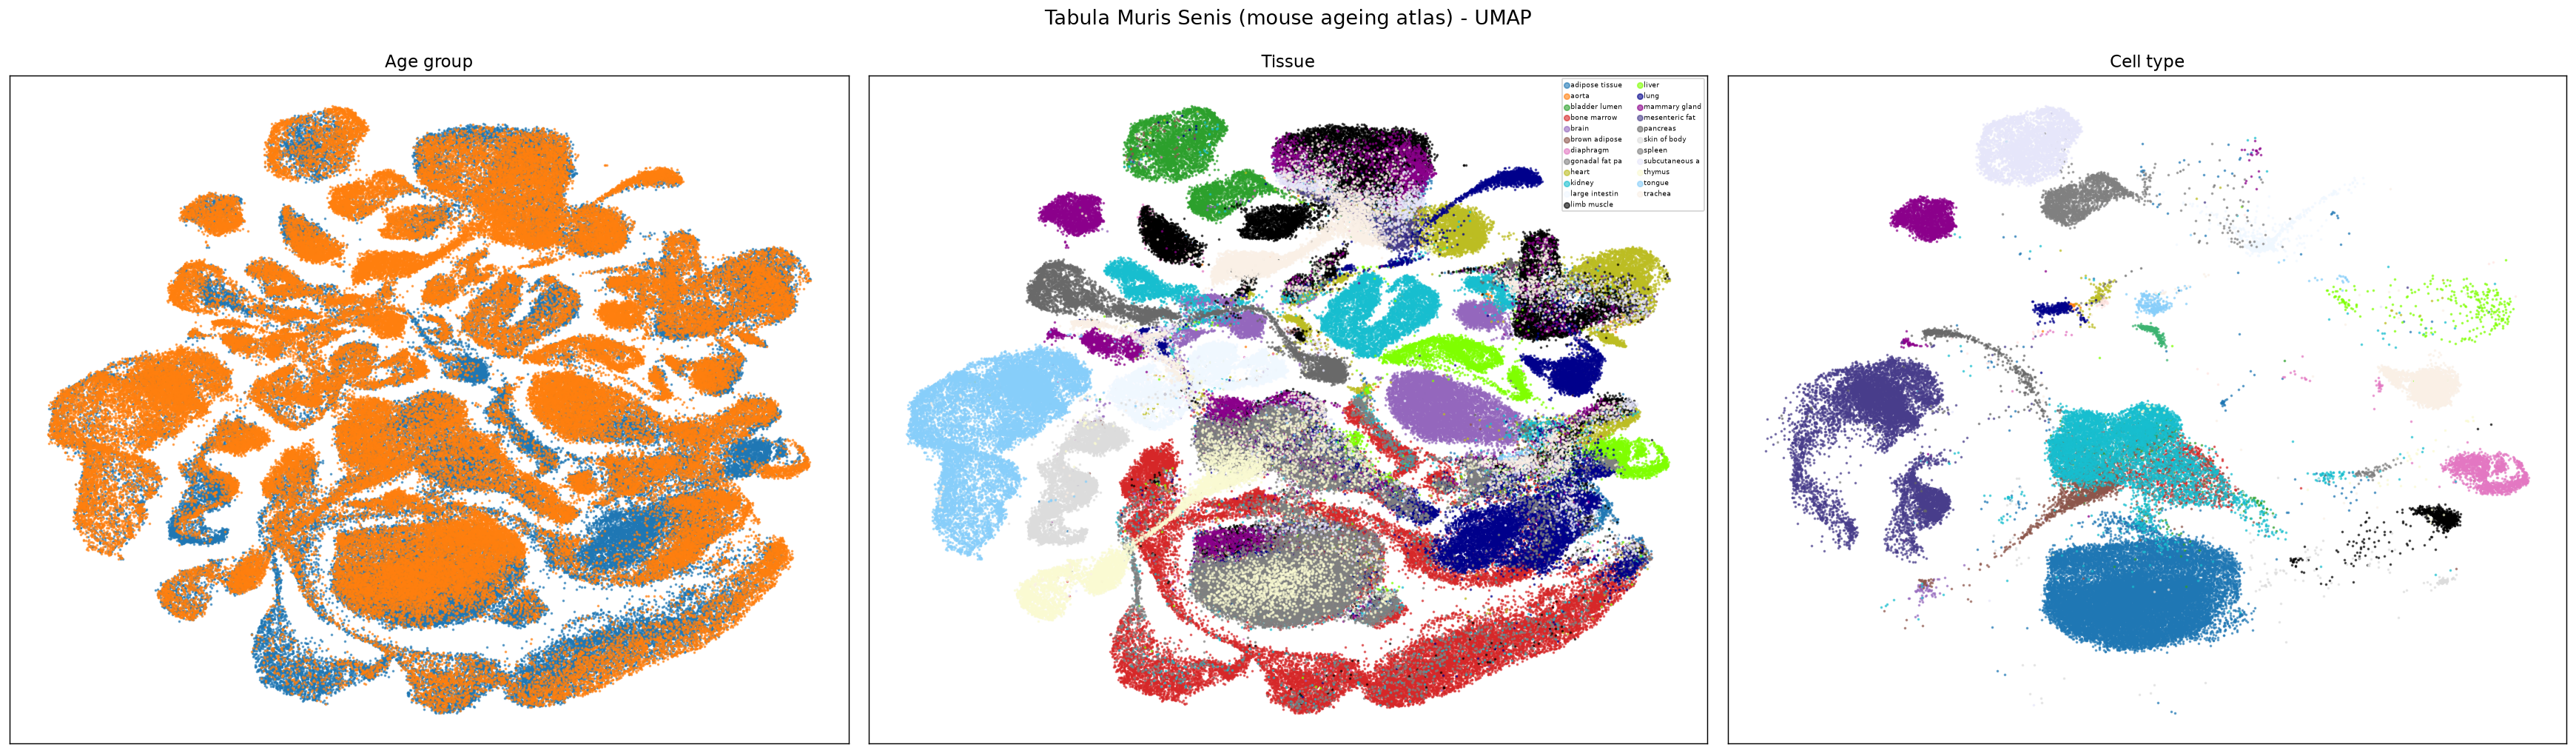
Existing official embedding, subsampled for display. Left→right: age group · tissue · cell type.
Age and tissue coverage
Six chronological ages (1, 3, 18, 21, 24, 30 months). Young = 1/3/18 m; Old = 21/24/30 m.
| Age | Cells |
|---|---|
| 1m | 25,980 |
| 3m | 90,120 |
| 18m | 78,672 |
| 21m | 36,556 |
| 24m | 69,211 |
| 30m | 55,674 |
| Tissue | Cells |
|---|---|
| bone marrow | 54,737 |
| spleen | 39,552 |
| limb muscle | 32,722 |
| lung | 29,758 |
| tongue | 24,415 |
| kidney | 23,480 |
| brain | 20,666 |
| heart | 18,282 |
| mammary gland | 15,577 |
| thymus | 13,322 |
| bladder lumen | 11,377 |
| trachea | 11,136 |
Old vs Young composition
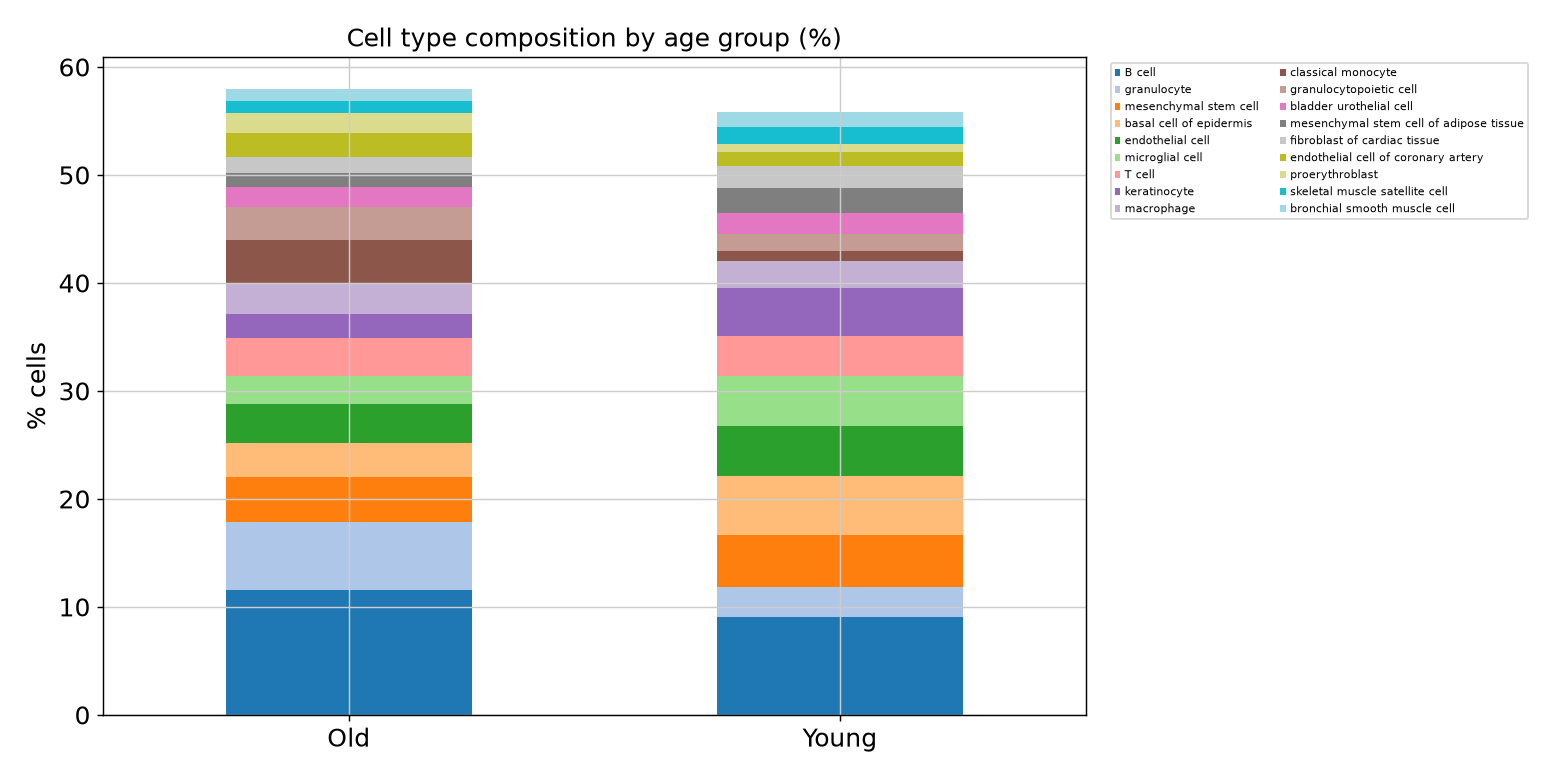
Top 20 cell types by total cells. Composition is computed on the full official object (356,213 cells, 151 types). B cells remain abundant; granulocytes rise in old mice; several epithelial / stem compartments shrink.
| Cell type | Young | Old | Total | Young % | Old % |
|---|---|---|---|---|---|
| B cell | 17,699 | 18,650 | 36,349 | 9.09 | 11.55 |
| mesenchymal stem cell | 9,357 | 6,785 | 16,142 | 4.8 | 4.2 |
| basal cell of epidermis | 10,591 | 5,054 | 15,645 | 5.44 | 3.13 |
| granulocyte | 5,385 | 10,177 | 15,562 | 2.76 | 6.3 |
| endothelial cell | 9,050 | 5,772 | 14,822 | 4.65 | 3.58 |
| microglial cell | 8,999 | 4,269 | 13,268 | 4.62 | 2.64 |
| T cell | 7,165 | 5,580 | 12,745 | 3.68 | 3.46 |
| keratinocyte | 8,735 | 3,622 | 12,357 | 4.48 | 2.24 |
| macrophage | 4,930 | 4,701 | 9,631 | 2.53 | 2.91 |
| classical monocyte | 1,740 | 6,384 | 8,124 | 0.89 | 3.95 |
| granulocytopoietic cell | 3,116 | 4,966 | 8,082 | 1.6 | 3.08 |
| bladder urothelial cell | 3,780 | 2,871 | 6,651 | 1.94 | 1.78 |
| mesenchymal stem cell of adipose tissue | 4,462 | 2,164 | 6,626 | 2.29 | 1.34 |
| fibroblast of cardiac tissue | 3,988 | 2,347 | 6,335 | 2.05 | 1.45 |
| endothelial cell of coronary artery | 2,427 | 3,560 | 5,987 | 1.25 | 2.21 |
| skeletal muscle satellite cell | 3,020 | 1,760 | 4,780 | 1.55 | 1.09 |
| proerythroblast | 1,592 | 3,085 | 4,677 | 0.82 | 1.91 |
| kidney proximal convoluted tubule epithelial cell | 2,736 | 1,724 | 4,460 | 1.4 | 1.07 |
| bronchial smooth muscle cell | 2,597 | 1,859 | 4,456 | 1.33 | 1.15 |
| myeloid cell | 3,204 | 1,223 | 4,427 | 1.65 | 0.76 |
Differential expression — Old vs Young
Wilcoxon rank-sums on a balanced 120k-cell subsample (young 1/3/18 m vs old 21/24/30 m), after CP10K + log1p. Gene symbols mapped from Ensembl IDs in the official object. Cross-tissue DE is exploratory — composition shifts contribute to the signal.
Up in Old (aged ↑)
| Gene | log2FC | padj |
|---|---|---|
| Ngp | 19.79 | 0.0e+0 |
| Xist | 4.79 | 0.0e+0 |
| Cd74 | 14.54 | 0.0e+0 |
| B2m | 7.28 | 0.0e+0 |
| Malat1 | 14.53 | 0.0e+0 |
| Camp | 26.86 | 0.0e+0 |
| Psmb8 | 1.09 | 0.0e+0 |
| Arhgdib | 1.59 | 0.0e+0 |
| Ptprcap | 1.31 | 0.0e+0 |
| H2-K1 | 2.52 | 0.0e+0 |
| H2-Eb1 | 3.31 | 0.0e+0 |
| H2-Ab1 | 4.27 | 0.0e+0 |
Down in Old (aged ↓)
| Gene | log2FC | padj |
|---|---|---|
| Prdx1 | -4.71 | 0.0e+0 |
| Hspa8 | -6.02 | 0.0e+0 |
| Mt1 | -5.7 | 0.0e+0 |
| Ctsd | -2.48 | 0.0e+0 |
| Sgk1 | -1.53 | 0.0e+0 |
| P4hb | -1.79 | 0.0e+0 |
| Gadd45g | -1.51 | 0.0e+0 |
| Cebpb | -3.91 | 0.0e+0 |
| Tagln2 | -3.02 | 0.0e+0 |
| Lamp1 | -1.4 | 0.0e+0 |
| Igfbp7 | -4.18 | 0.0e+0 |
| Lamp2 | -1.02 | 0.0e+0 |
Source and related views
The 5.7 G official complete h5ad stays on the compute host; this page ships the analysis tables and figures. Per-tissue TMS slices already exist in the mouse species table.
Open LACA data card ↗ Open mouse species view ↗ GEO GSE132042 ↗